
Search for Indicators
Access to Care
Access to Care Issue Action Group Goal: All Calhoun County residents will have 100% access to health care & preventive service.
Indicator Gauge Icon Legend
Legend Colors
Red is bad, green is good, blue is not statistically different/neutral.
Compared to Distribution
 the value is in the best half of communities.
 the value is in the 2nd worst quarter of communities.
 the value is in the worst quarter of communities.
Compared to Target
 meets target;
  does not meet target.
Compared to a Single Value
 lower than the comparison value;
 higher than the comparison value;
 not statistically different from comparison value.
Trend

 non-significant change over time;
 significant change over time;
  no change over time.
Compared to Prior Value
 higher than the previous measurement period;
 lower than the previous measurement period;
 no statistically different change from previous measurement period.
 Significantly better than the overall value
 Significantly worse than the overall value
 Significantly different than the overall value
 No significant difference with the overall value
 No data on significance available
County: Calhoun
Access to Care
Value
Compared to:
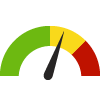
County: Calhoun Adults who have had a Routine Checkup
County: Calhoun Adults who have had a Routine Checkup
75.5%
(2020-2022)
Compared to:


MI Value
(77.7%)
The regional value is compared to the Michigan State value.
Prior Value
(79.9%)
Prior Value compares a measured value with the previously measured value. Confidence intervals were not taken into account in determining the direction of the comparison.
Trend
This comparison measures the indicator’s values over multiple time periods.<br>The Mann-Kendall Test for Statistical Significance is used to evaluate the trend<br>over 4 to 10 periods of measure, subject to data availability and comparability.
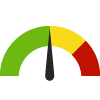
County: Calhoun Adults with a Usual Source of Health Care
County: Calhoun Adults with a Usual Source of Health Care
87.4%
(2020-2022)
Compared to:
MI Value
(87.6%)
The regional value is compared to the Michigan State value.
US Value
(84.0% in 2022)
The regional value is compared to the national value. The source for the national value is Behavioral Risk Factor Surveillance System
Prior Value
(88.5%)
Prior Value compares a measured value with the previously measured value. Confidence intervals were not taken into account in determining the direction of the comparison.
Trend
This comparison measures the indicator’s values over multiple time periods.<br>The Mann-Kendall Test for Statistical Significance is used to evaluate the trend<br>over 4 to 10 periods of measure, subject to data availability and comparability.
County: Calhoun Adults with Health Insurance: 18-64
County: Calhoun Adults with Health Insurance: 18-64
92.1%
(2021)
Compared to:
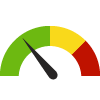
MI Counties
The distribution is based on data from 83 Michigan counties.
U.S. Counties
The distribution is based on data from 3,140 U.S. counties and county equivalents.
MI Value
(92.9%)
The regional value is compared to the Michigan State value.
Prior Value
(92.2%)
Prior Value compares a measured value with the previously measured value. Confidence intervals were taken into account in determining the direction of the comparison.
Trend
This comparison measures the indicator’s values over multiple time periods.<br>The Mann-Kendall Test for Statistical Significance is used to evaluate the trend<br>over 4 to 10 periods of measure, subject to data availability and comparability.
County: Calhoun Children with Health Insurance
County: Calhoun Children with Health Insurance
96.7%
(2021)
Compared to:
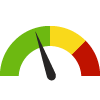
MI Counties
The distribution is based on data from 83 Michigan counties.
U.S. Counties
The distribution is based on data from 3,140 U.S. counties and county equivalents.
MI Value
(97.0%)
The regional value is compared to the Michigan State value.
Prior Value
(96.8%)
Prior Value compares a measured value with the previously measured value. Confidence intervals were taken into account in determining the direction of the comparison.
Trend
This comparison measures the indicator’s values over multiple time periods.<br>The Mann-Kendall Test for Statistical Significance is used to evaluate the trend<br>over 4 to 10 periods of measure, subject to data availability and comparability.
County: Calhoun Non-Physician Primary Care Provider Rate
County: Calhoun Non-Physician Primary Care Provider Rate
143
Providers per 100,000 population
(2023)
Compared to:

MI Counties
The distribution is based on data from 83 Michigan counties.
U.S. Counties
The distribution is based on data from 3,129 U.S. counties and county equivalents.
MI Value
(141)
The regional value is compared to the Michigan State value.
Prior Value
(142)
Prior Value compares a measured value with the previously measured value. Confidence intervals were not taken into account in determining the direction of the comparison.
Trend
This comparison measures the indicator’s values over multiple time periods.<br>The Mann-Kendall Test for Statistical Significance is used to evaluate the trend<br>over 4 to 10 periods of measure, subject to data availability and comparability.
County: Calhoun Persons with Private Health Insurance Only
County: Calhoun Persons with Private Health Insurance Only
51.6%
(2022)
Compared to:


MI Value
(54.5%)
The regional value is compared to the Michigan State value.
US Value
(54.8%)
The regional value is compared to the national value.
Prior Value
(51.0%)
Prior Value compares a measured value with the previously measured value. Confidence intervals were not taken into account in determining the direction of the comparison.
Trend
This comparison measures the indicator’s values over multiple time periods.<br>The Mann-Kendall Test for Statistical Significance is used to evaluate the trend<br>over 4 to 10 periods of measure, subject to data availability and comparability.
County: Calhoun Persons with Public Health Insurance Only
County: Calhoun Persons with Public Health Insurance Only
25.6%
(2022)
Compared to:


MI Value
(25.1%)
The regional value is compared to the Michigan State value.
US Value
(24.8%)
The regional value is compared to the national value.
Prior Value
(28.1%)
Prior Value compares a measured value with the previously measured value. Confidence intervals were not taken into account in determining the direction of the comparison.
Trend
This comparison measures the indicator’s values over multiple time periods.<br>The Mann-Kendall Test for Statistical Significance is used to evaluate the trend<br>over 4 to 10 periods of measure, subject to data availability and comparability.
County: Calhoun Primary Care Provider Rate
County: Calhoun Primary Care Provider Rate
58
Providers per 100,000 population
(2021)
Compared to:

MI Counties
The distribution is based on data from 82 Michigan counties.
U.S. Counties
The distribution is based on data from 2,984 U.S. counties and county equivalents.
MI Value
(78)
The regional value is compared to the Michigan State value.
Prior Value
(59)
Prior Value compares a measured value with the previously measured value. Confidence intervals were not taken into account in determining the direction of the comparison.
Trend
This comparison measures the indicator’s values over multiple time periods.<br>The Mann-Kendall Test for Statistical Significance is used to evaluate the trend<br>over 4 to 10 periods of measure, subject to data availability and comparability.
County: Calhoun
Mental Health & Mental Disorders
Value
Compared to:
County: Calhoun Age-Adjusted Death Rate due to Suicide
County: Calhoun Age-Adjusted Death Rate due to Suicide
17.8
Deaths per 100,000 population
(2018-2022)
Compared to:


MI Counties
The distribution is based on data from 61 Michigan counties.
MI Value
(14.4)
The regional value is compared to the Michigan State value.
US Value
(13.5 in 2020)
The regional value is compared to the national value. The source for the national value is Centers for Disease Control and Prevention
Prior Value
(19.7)
Prior Value compares a measured value with the previously measured value. Confidence intervals were taken into account in determining the direction of the comparison.
Trend
This comparison measures the indicator’s values over multiple time periods.<br>The Mann-Kendall Test for Statistical Significance is used to evaluate the trend<br>over 4 to 10 periods of measure, subject to data availability and comparability.
HP 2030 Target
(12.8)
<div>MHMD-01: Reduce the suicide rate <strong>(LEADING HEALTH INDICATOR)</strong></div>
County: Calhoun Depression: Medicare Population
County: Calhoun Depression: Medicare Population
21.0%
(2022)
Compared to:


MI Counties
The distribution is based on data from 83 Michigan counties.
U.S. Counties
The distribution is based on data from 3,129 U.S. counties and county equivalents.
MI Value
(18.0%)
The regional value is compared to the Michigan State value.
US Value
(16.0%)
The regional value is compared to the national value.
Prior Value
(21.0%)
Prior Value compares a measured value with the previously measured value. Confidence intervals were not taken into account in determining the direction of the comparison.
Trend
This comparison measures the indicator’s values over multiple time periods.<br>The Mann-Kendall Test for Statistical Significance is used to evaluate the trend<br>over 4 to 10 periods of measure, subject to data availability and comparability.
County: Calhoun Mental Health Provider Rate
County: Calhoun Mental Health Provider Rate
388
Providers per 100,000 population
(2023)
Compared to:
MI Counties
The distribution is based on data from 83 Michigan counties.
U.S. Counties
The distribution is based on data from 2,956 U.S. counties and county equivalents.
MI Value
(336)
The regional value is compared to the Michigan State value.
Prior Value
(375)
Prior Value compares a measured value with the previously measured value. Confidence intervals were not taken into account in determining the direction of the comparison.
Trend
This comparison measures the indicator’s values over multiple time periods.<br>The Mann-Kendall Test for Statistical Significance is used to evaluate the trend<br>over 4 to 10 periods of measure, subject to data availability and comparability.
County: Calhoun Poor Mental Health: 14+ Days
County: Calhoun Poor Mental Health: 14+ Days
20.6%
(2020-2022)
Compared to:

MI Value
(16.0%)
The regional value is compared to the Michigan State value.
Prior Value
(18.9%)
Prior Value compares a measured value with the previously measured value. Confidence intervals were not taken into account in determining the direction of the comparison.
Trend
This comparison measures the indicator’s values over multiple time periods.<br>The Mann-Kendall Test for Statistical Significance is used to evaluate the trend<br>over 4 to 10 periods of measure, subject to data availability and comparability.
County: Calhoun
Oral Health
Value
Compared to:
County: Calhoun Dentist Rate
County: Calhoun Dentist Rate
72
Dentists per 100,000 population
(2022)
Compared to:
MI Counties
The distribution is based on data from 83 Michigan counties.
U.S. Counties
The distribution is based on data from 3,054 U.S. counties and county equivalents.
MI Value
(80)
The regional value is compared to the Michigan State value.
Prior Value
(70)
Prior Value compares a measured value with the previously measured value. Confidence intervals were not taken into account in determining the direction of the comparison.
Trend
This comparison measures the indicator’s values over multiple time periods.<br>The Mann-Kendall Test for Statistical Significance is used to evaluate the trend<br>over 4 to 10 periods of measure, subject to data availability and comparability.
County: Calhoun
Substance Use
Value
Compared to:
County: Calhoun Adults who Binge Drink
County: Calhoun Adults who Binge Drink
17.7%
(2020-2022)
Compared to:
MI Value
(16.9%)
The regional value is compared to the Michigan State value.
US Value
(17.0% in 2022)
The regional value is compared to the national value. The source for the national value is Behavioral Risk Factor Surveillance System
Prior Value
(14.0%)
Prior Value compares a measured value with the previously measured value. Confidence intervals were not taken into account in determining the direction of the comparison.
Trend
This comparison measures the indicator’s values over multiple time periods.<br>The Mann-Kendall Test for Statistical Significance is used to evaluate the trend<br>over 4 to 10 periods of measure, subject to data availability and comparability.
County: Calhoun Adults who Smoke
County: Calhoun Adults who Smoke
25.8%
(2020-2022)
Compared to:
MI Value
(16.9%)
The regional value is compared to the Michigan State value.
US Value
(14.0% in 2022)
The regional value is compared to the national value. The source for the national value is Behavioral Risk Factor Surveillance System
Prior Value
(26.9%)
Prior Value compares a measured value with the previously measured value. Confidence intervals were not taken into account in determining the direction of the comparison.
Trend
This comparison measures the indicator’s values over multiple time periods.<br>The Mann-Kendall Test for Statistical Significance is used to evaluate the trend<br>over 4 to 10 periods of measure, subject to data availability and comparability.
HP 2030 Target
(6.1%)
<div>TU-02: Reduce current cigarette smoking in adults <strong>(LEADING HEALTH INDICATOR)</strong></div>
County: Calhoun Adults who Used to Smoke
County: Calhoun Adults who Used to Smoke
32.2%
(2020-2022)
Compared to:
MI Value
(26.5%)
The regional value is compared to the Michigan State value.
Prior Value
(31.9%)
Prior Value compares a measured value with the previously measured value. Confidence intervals were not taken into account in determining the direction of the comparison.
Trend
This comparison measures the indicator’s values over multiple time periods.<br>The Mann-Kendall Test for Statistical Significance is used to evaluate the trend<br>over 4 to 10 periods of measure, subject to data availability and comparability.
County: Calhoun Death Rate due to Drug Poisoning
County: Calhoun Death Rate due to Drug Poisoning
47.8
Deaths per 100,000 population
(2021)
Compared to:
MI Counties
The distribution is based on data from 83 Michigan counties.
MI Value
(30.8)
The regional value is compared to the Michigan State value.
Prior Value
(42.7)
Prior Value compares a measured value with the previously measured value. Confidence intervals were not taken into account in determining the direction of the comparison.
Trend
This comparison measures the indicator’s values over multiple time periods.<br>The Mann-Kendall Test for Statistical Significance is used to evaluate the trend<br>over 4 to 10 periods of measure, subject to data availability and comparability.
HP 2030 Target
(20.7)
<div>SU-03: Reduce drug overdose deaths <strong>(LEADING HEALTH INDICATOR)</strong></div>
County: Calhoun Teens who Binge Drink: 9th, 11th Graders
County: Calhoun Teens who Binge Drink: 9th, 11th Graders
9.1%
(2022)
Compared to:
MI Value
(11.2% in 2020)
The regional value is compared to the 2019 Michigan state value for 9th - 12th graders.
Prior Value
(10.7%)
Prior Value compares a measured value with the previously measured value. Confidence intervals were not taken into account in determining the direction of the comparison.
Trend
This comparison measures the indicator’s values over multiple time periods.<br>The Mann-Kendall Test for Statistical Significance is used to evaluate the trend<br>over 4 to 10 periods of measure, subject to data availability and comparability.
County: Calhoun Teens who Smoke: 9th, 11th Graders
County: Calhoun Teens who Smoke: 9th, 11th Graders
1.3%
(2022)
Compared to:
MI Value
(4.5% in 2020)
The regional value is compared to the 2019 Michigan state value for 9th - 12th graders.
Prior Value
(1.8%)
Prior Value compares a measured value with the previously measured value. Confidence intervals were not taken into account in determining the direction of the comparison.
Trend
This comparison measures the indicator’s values over multiple time periods.<br>The Mann-Kendall Test for Statistical Significance is used to evaluate the trend<br>over 4 to 10 periods of measure, subject to data availability and comparability.
County: Calhoun Teens who Use Marijuana: 9th, 11th Graders
County: Calhoun Teens who Use Marijuana: 9th, 11th Graders
14.3%
(2022)
Compared to:
MI Value
(21.6% in 2020)
The regional value is compared to the 2019 Michigan state value for 9th - 12th graders.
Prior Value
(17.1%)
Prior Value compares a measured value with the previously measured value. Confidence intervals were not taken into account in determining the direction of the comparison.
Trend
This comparison measures the indicator’s values over multiple time periods.<br>The Mann-Kendall Test for Statistical Significance is used to evaluate the trend<br>over 4 to 10 periods of measure, subject to data availability and comparability.
County: Calhoun
Wellness & Lifestyle
Value
Compared to:
County: Calhoun Insufficient Sleep
County: Calhoun Insufficient Sleep
36.9%
(2020)
Compared to:

MI Counties
The distribution is based on data from 83 Michigan counties.
U.S. Counties
The distribution is based on data from 3,140 U.S. counties and county equivalents.
MI Value
(35.5%)
The regional value is compared to the Michigan State value.
US Value
(33.0%)
The regional value is compared to the national value.
Prior Value
(39.5%)
Prior Value compares a measured value with the previously measured value. Confidence intervals were not taken into account in determining the direction of the comparison.
HP 2030 Target
(26.7%)
County: Calhoun Life Expectancy
County: Calhoun Life Expectancy
74.4
Years
(2019-2021)
Compared to:
MI Counties
The distribution is based on data from 83 Michigan counties.
U.S. Counties
The distribution is based on data from 3,070 U.S. counties and county equivalents.
MI Value
(76.6)
The regional value is compared to the Michigan State value.
US Value
(77.6)
The regional value is compared to the national value.
County: Calhoun Limited Activity due to a Health Problem
County: Calhoun Limited Activity due to a Health Problem
15.2%
(2020-2022)
Compared to:
MI Value
(9.7%)
The regional value is compared to the Michigan State value.
Prior Value
(14.2%)
Prior Value compares a measured value with the previously measured value. Confidence intervals were not taken into account in determining the direction of the comparison.
Trend
This comparison measures the indicator’s values over multiple time periods.<br>The Mann-Kendall Test for Statistical Significance is used to evaluate the trend<br>over 4 to 10 periods of measure, subject to data availability and comparability.
County: Calhoun Poor Physical Health: 14+ Days
County: Calhoun Poor Physical Health: 14+ Days
15.1%
(2020-2022)
Compared to:
MI Value
(11.9%)
The regional value is compared to the Michigan State value.
Prior Value
(18.6%)
Prior Value compares a measured value with the previously measured value. Confidence intervals were not taken into account in determining the direction of the comparison.
Trend
This comparison measures the indicator’s values over multiple time periods.<br>The Mann-Kendall Test for Statistical Significance is used to evaluate the trend<br>over 4 to 10 periods of measure, subject to data availability and comparability.
County: Calhoun Self-Reported General Health Assessment: Poor or Fair
County: Calhoun Self-Reported General Health Assessment: Poor or Fair
26.9%
(2020-2022)
Compared to:
MI Value
(16.3%)
The regional value is compared to the Michigan State value.
US Value
(17.0% in 2022)
The regional value is compared to the national value. The source for the national value is Behavioral Risk Factor Surveillance System
Prior Value
(24.4%)
Prior Value compares a measured value with the previously measured value. Confidence intervals were not taken into account in determining the direction of the comparison.
Trend
This comparison measures the indicator’s values over multiple time periods.<br>The Mann-Kendall Test for Statistical Significance is used to evaluate the trend<br>over 4 to 10 periods of measure, subject to data availability and comparability.
County: Calhoun
Poverty
Value
Compared to:
County: Calhoun Children Living Below Poverty Level
County: Calhoun Children Living Below Poverty Level
23.1%
(2018-2022)
Compared to:
MI Counties
The distribution is based on data from 83 Michigan counties.
U.S. Counties
The distribution is based on data from 3,132 U.S. counties and county equivalents.
MI Value
(17.8%)
The regional value is compared to the Michigan State value.
US Value
(16.7%)
The regional value is compared to the national value.
Trend
This comparison measures the indicator’s values over multiple time periods.<br>The Mann-Kendall Test for Statistical Significance is used to evaluate the trend<br>over 4 to 10 periods of measure, subject to data availability and comparability.
County: Calhoun Families Living Below Poverty Level
County: Calhoun Families Living Below Poverty Level
10.3%
(2018-2022)
Compared to:
MI Counties
The distribution is based on data from 83 Michigan counties.
U.S. Counties
The distribution is based on data from 3,104 U.S. counties and county equivalents.
MI Value
(8.8%)
The regional value is compared to the Michigan State value.
US Value
(8.8%)
The regional value is compared to the national value.
Trend
This comparison measures the indicator’s values over multiple time periods.<br>The Mann-Kendall Test for Statistical Significance is used to evaluate the trend<br>over 4 to 10 periods of measure, subject to data availability and comparability.
County: Calhoun Households Receiving SNAP with Children
County: Calhoun Households Receiving SNAP with Children
41.0%
(2018-2022)
Compared to:

MI Value
(43.0%)
The regional value is compared to the Michigan State value.
US Value
(47.9%)
The regional value is compared to the national value.
Trend
This comparison measures the indicator’s values over multiple time periods.<br>The Mann-Kendall Test for Statistical Significance is used to evaluate the trend<br>over 4 to 10 periods of measure, subject to data availability and comparability.
County: Calhoun People 65+ Living Below Poverty Level
County: Calhoun People 65+ Living Below Poverty Level
10.2%
(2018-2022)
Compared to:
MI Counties
The distribution is based on data from 83 Michigan counties.
U.S. Counties
The distribution is based on data from 3,133 U.S. counties and county equivalents.
MI Value
(9.0%)
The regional value is compared to the Michigan State value.
US Value
(10.0%)
The regional value is compared to the national value.
Trend
This comparison measures the indicator’s values over multiple time periods.<br>The Mann-Kendall Test for Statistical Significance is used to evaluate the trend<br>over 4 to 10 periods of measure, subject to data availability and comparability.
County: Calhoun People Living 200% Above Poverty Level
County: Calhoun People Living 200% Above Poverty Level
64.5%
(2018-2022)
Compared to:
MI Counties
The distribution is based on data from 83 Michigan counties.
U.S. Counties
The distribution is based on data from 3,133 U.S. counties and county equivalents.
MI Value
(70.5%)
The regional value is compared to the Michigan State value.
US Value
(71.2%)
The regional value is compared to the national value.
Trend
This comparison measures the indicator’s values over multiple time periods.<br>The Mann-Kendall Test for Statistical Significance is used to evaluate the trend<br>over 4 to 10 periods of measure, subject to data availability and comparability.
County: Calhoun People Living Below Poverty Level
County: Calhoun People Living Below Poverty Level
14.8%
(2018-2022)
Compared to:
MI Counties
The distribution is based on data from 83 Michigan counties.
U.S. Counties
The distribution is based on data from 3,133 U.S. counties and county equivalents.
MI Value
(13.1%)
The regional value is compared to the Michigan State value.
US Value
(12.5%)
The regional value is compared to the national value.
Trend
This comparison measures the indicator’s values over multiple time periods.<br>The Mann-Kendall Test for Statistical Significance is used to evaluate the trend<br>over 4 to 10 periods of measure, subject to data availability and comparability.
HP 2030 Target
(8.0%)
County: Calhoun Young Children Living Below Poverty Level
County: Calhoun Young Children Living Below Poverty Level
29.0%
(2018-2022)
Compared to:
MI Counties
The distribution is based on data from 83 Michigan counties.
U.S. Counties
The distribution is based on data from 3,131 U.S. counties and county equivalents.
MI Value
(20.1%)
The regional value is compared to the Michigan State value.
US Value
(18.1%)
The regional value is compared to the national value.
Trend
This comparison measures the indicator’s values over multiple time periods.<br>The Mann-Kendall Test for Statistical Significance is used to evaluate the trend<br>over 4 to 10 periods of measure, subject to data availability and comparability.
