Search for Indicators
Albion Data
Indicators of health and quality of life in Albion tend to be worse than other areas of Calhoun County and Michigan as a whole.
For instance, Albion is ranked in the worst quintile (5 out of 5) for the Health Equity Index, the Mental Health Index, and Food Insecurity Index.
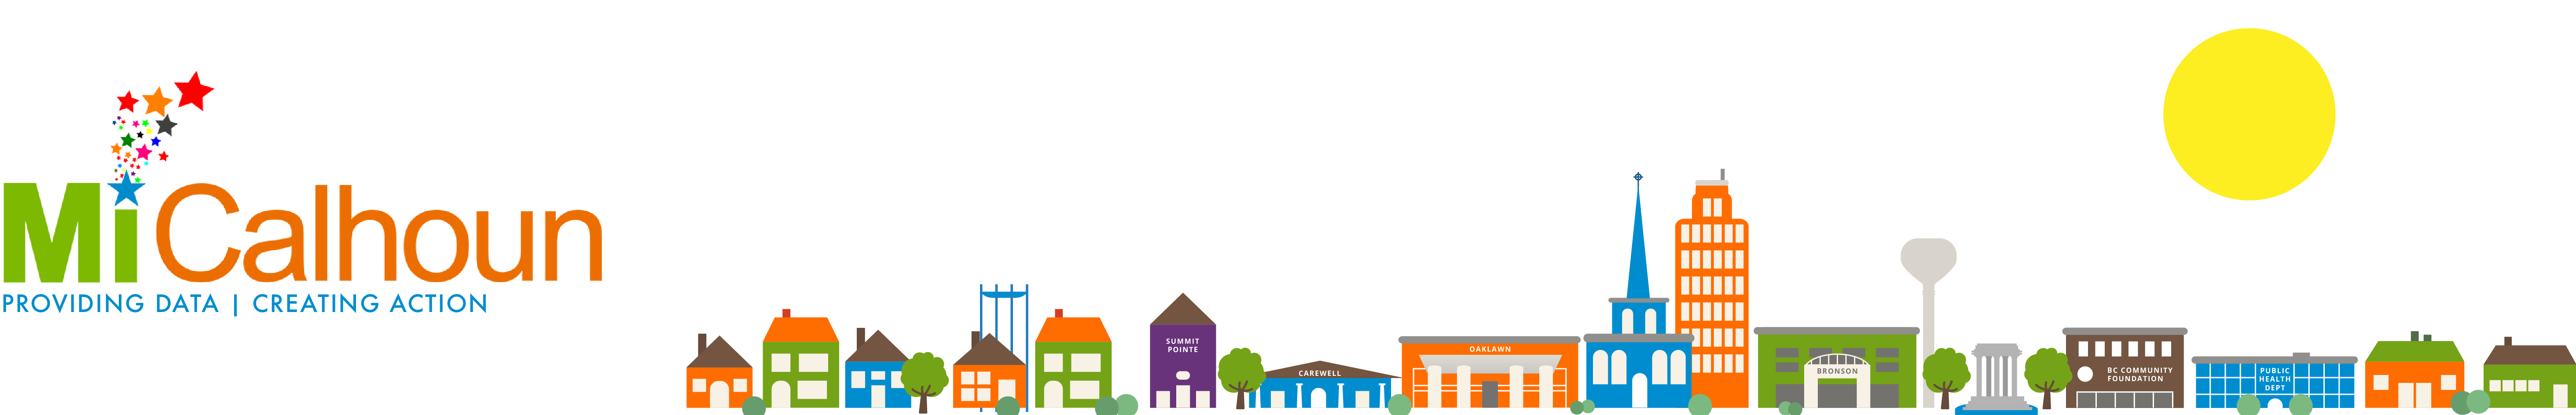
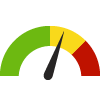
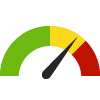
Indicator Gauge Icon Legend
Legend Colors
Red is bad, green is good, blue is not statistically different/neutral.
Compared to Distribution
 the value is in the best half of communities.
 the value is in the 2nd worst quarter of communities.
 the value is in the worst quarter of communities.
Compared to Target
 meets target;
  does not meet target.
Compared to a Single Value
 lower than the comparison value;
 higher than the comparison value;
 not statistically different from comparison value.
Trend

 non-significant change over time;
 significant change over time;
  no change over time.
Compared to Prior Value
 higher than the previous measurement period;
 lower than the previous measurement period;
 no statistically different change from previous measurement period.
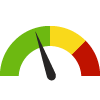
Areas of Particular Concern
Adults with Diabetes Census Place: Albion
Adults with Diabetes Census Place: Albion
12.3%
(2021)
Compared to:

MI Census Places
The distribution is based on data from 690 locales.
U.S. Census Places
The distribution is based on data from 27,528 U.S. Census Places.
US Value
(11.3%)
The regional value is compared to the national value.
Adults who Experienced a Stroke Census Place: Albion
Adults who Experienced a Stroke Census Place: Albion
3.8%
(2021)
Compared to:
MI Census Places
The distribution is based on data from 690 locales.
U.S. Census Places
The distribution is based on data from 27,528 U.S. Census Places.
Calhoun, MI County Value
(3.7%)
The regional value is compared to the Calhoun County value.
US Value
(3.3%)
The regional value is compared to the national value.
Adults without Health Insurance Census Place: Albion
Adults without Health Insurance Census Place: Albion
9.7%
(2021)
Compared to:
MI Census Places
The distribution is based on data from 690 locales.
U.S. Census Places
The distribution is based on data from 27,528 U.S. Census Places.
Calhoun, MI County Value
(8.4%)
The regional value is compared to the Calhoun County value.
US Value
(10.8%)
The regional value is compared to the national value.
Adults Ever Diagnosed with Depression Census Place: Albion
Adults Ever Diagnosed with Depression Census Place: Albion
25.8%
(2021)
Compared to:
MI Census Places
The distribution is based on data from 690 locales.
U.S. Census Places
The distribution is based on data from 27,528 U.S. Census Places.
Calhoun, MI County Value
(23.9%)
The regional value is compared to the Calhoun County value.
US Value
(19.5%)
The regional value is compared to the national value.
Poor Mental Health: 14+ Days Census Place: Albion
Poor Mental Health: 14+ Days Census Place: Albion
20.8%
(2021)
Compared to:

MI Census Places
The distribution is based on data from 690 locales.
U.S. Census Places
The distribution is based on data from 27,528 U.S. Census Places.
Calhoun, MI County Value
(16.8%)
The regional value is compared to the Calhoun County value.
US Value
(14.7%)
The regional value is compared to the national value.
Adults 65+ with Total Tooth Loss Census Place: Albion
Adults 65+ with Total Tooth Loss Census Place: Albion
21.6%
(2020)
Compared to:
MI Census Places
The distribution is based on data from 690 locales.
U.S. Census Places
The distribution is based on data from 28,418 U.S. Census Places.
Calhoun, MI County Value
(11.8%)
The regional value is compared to the Calhoun County value.
US Value
(13.4%)
The regional value is compared to the national value.
Adults with Kidney Disease Census Place: Albion
Adults with Kidney Disease Census Place: Albion
3.4%
(2021)
Compared to:
MI Census Places
The distribution is based on data from 690 locales.
U.S. Census Places
The distribution is based on data from 27,528 U.S. Census Places.
Calhoun, MI County Value
(3.5%)
The regional value is compared to the Calhoun County value.
US Value
(3.1%)
The regional value is compared to the national value.
Children Living Below Poverty Level Census Place: Albion
Children Living Below Poverty Level Census Place: Albion
40.4%
(2018-2022)
Compared to:
MI Census Places
The distribution is based on data from 682 locales.
U.S. Census Places
The distribution is based on data from 27,556 U.S. Census Places.
Calhoun, MI County Value
(23.1%)
The regional value is compared to the Calhoun County value.
MI Value
(17.8%)
The regional value is compared to the Michigan State value.
US Value
(16.7%)
The regional value is compared to the national value.
Trend
This comparison measures the indicator’s values over multiple time periods.<br>The Mann-Kendall Test for Statistical Significance is used to evaluate the trend<br>over 4 to 10 periods of measure, subject to data availability and comparability.
Other Data Indicators
Adults who Binge Drink Census Place: Albion
Adults who Binge Drink Census Place: Albion
15.7%
(2021)
Compared to:

MI Census Places
The distribution is based on data from 690 locales.
U.S. Census Places
The distribution is based on data from 27,528 U.S. Census Places.
Calhoun, MI County Value
(15.3%)
The regional value is compared to the Calhoun County value.
US Value
(15.5%)
The regional value is compared to the national value.
Cervical Cancer Screening: 21-65 Census Place: Albion
Cervical Cancer Screening: 21-65 Census Place: Albion
79.2%
(2020)
Compared to:


MI Census Places
The distribution is based on data from 690 locales.
U.S. Census Places
The distribution is based on data from 28,438 U.S. Census Places.
Calhoun, MI County Value
(82.6%)
The regional value is compared to the Calhoun County value.
US Value
(82.8%)
The regional value is compared to the national value.
Colon Cancer Screening: USPSTF Recommendation Census Place: Albion
Colon Cancer Screening: USPSTF Recommendation Census Place: Albion
72.3%
(2020)
Compared to:
MI Census Places
The distribution is based on data from 690 locales.
U.S. Census Places
The distribution is based on data from 28,435 U.S. Census Places.
Calhoun, MI County Value
(75.4%)
The regional value is compared to the Calhoun County value.
US Value
(72.4%)
The regional value is compared to the national value.
Mammogram in Past 2 Years: 50-74 Census Place: Albion
Mammogram in Past 2 Years: 50-74 Census Place: Albion
78.2%
(2020)
Compared to:
MI Census Places
The distribution is based on data from 690 locales.
U.S. Census Places
The distribution is based on data from 28,432 U.S. Census Places.
Calhoun, MI County Value
(73.0%)
The regional value is compared to the Calhoun County value.
US Value
(78.2%)
The regional value is compared to the national value.
HP 2030 Target
(80.3%)
Adults with Disability Living in Poverty Census Place: Albion
Adults with Disability Living in Poverty Census Place: Albion
38.9%
(2018-2022)
Compared to:
MI Census Places
The distribution is based on data from 679 locales.
U.S. Census Places
The distribution is based on data from 27,025 U.S. Census Places.
Calhoun, MI County Value
(29.8%)
The regional value is compared to the Calhoun County value.
MI Value
(26.9%)
The regional value is compared to the Michigan State value.
US Value
(24.9%)
The regional value is compared to the national value.
Trend
This comparison measures the indicator’s values over multiple time periods.<br>The Mann-Kendall Test for Statistical Significance is used to evaluate the trend<br>over 4 to 10 periods of measure, subject to data availability and comparability.
Children with a Disability Census Place: Albion
Children with a Disability Census Place: Albion
3.4%
(2018-2022)
Compared to:


Calhoun, MI County Value
(3.7%)
The regional value is compared to the Calhoun County value.
MI Value
(4.8%)
The regional value is compared to the Michigan State value.
US Value
(4.5%)
The regional value is compared to the national value.
Trend
This comparison measures the indicator’s values over multiple time periods.<br>The Mann-Kendall Test for Statistical Significance is used to evaluate the trend<br>over 4 to 10 periods of measure, subject to data availability and comparability.
Persons with a Disability Census Place: Albion
Persons with a Disability Census Place: Albion
13.9%
(2018-2022)
Compared to:

Calhoun, MI County Value
(14.3%)
The regional value is compared to the Calhoun County value.
MI Value
(14.1%)
The regional value is compared to the Michigan State value.
US Value
(12.9%)
The regional value is compared to the national value.
Prior Value
(14.3%)
Prior Value compares a measured value with the previously measured value. Confidence intervals were taken into account in determining the direction of the comparison.
Trend
This comparison measures the indicator’s values over multiple time periods.<br>The Mann-Kendall Test for Statistical Significance is used to evaluate the trend<br>over 4 to 10 periods of measure, subject to data availability and comparability.
Persons with a Cognitive Difficulty Census Place: Albion
Persons with a Cognitive Difficulty Census Place: Albion
7.2%
(2018-2022)
Compared to:
Calhoun, MI County Value
(6.3%)
The regional value is compared to the Calhoun County value.
MI Value
(6.0%)
The regional value is compared to the Michigan State value.
US Value
(5.3%)
The regional value is compared to the national value.
Trend
This comparison measures the indicator’s values over multiple time periods.<br>The Mann-Kendall Test for Statistical Significance is used to evaluate the trend<br>over 4 to 10 periods of measure, subject to data availability and comparability.
Persons with a Hearing Difficulty Census Place: Albion
Persons with a Hearing Difficulty Census Place: Albion
2.2%
(2018-2022)
Compared to:

Calhoun, MI County Value
(3.6%)
The regional value is compared to the Calhoun County value.
MI Value
(3.8%)
The regional value is compared to the Michigan State value.
US Value
(3.6%)
The regional value is compared to the national value.
Trend
This comparison measures the indicator’s values over multiple time periods.<br>The Mann-Kendall Test for Statistical Significance is used to evaluate the trend<br>over 4 to 10 periods of measure, subject to data availability and comparability.
Persons with a Self-Care Difficulty Census Place: Albion
Persons with a Self-Care Difficulty Census Place: Albion
2.2%
(2018-2022)
Compared to:
Calhoun, MI County Value
(2.8%)
The regional value is compared to the Calhoun County value.
MI Value
(2.8%)
The regional value is compared to the Michigan State value.
US Value
(2.6%)
The regional value is compared to the national value.
Trend
This comparison measures the indicator’s values over multiple time periods.<br>The Mann-Kendall Test for Statistical Significance is used to evaluate the trend<br>over 4 to 10 periods of measure, subject to data availability and comparability.
Persons with a Vision Difficulty Census Place: Albion
Persons with a Vision Difficulty Census Place: Albion
2.5%
(2018-2022)
Compared to:
Calhoun, MI County Value
(2.2%)
The regional value is compared to the Calhoun County value.
MI Value
(2.2%)
The regional value is compared to the Michigan State value.
US Value
(2.4%)
The regional value is compared to the national value.
Trend
This comparison measures the indicator’s values over multiple time periods.<br>The Mann-Kendall Test for Statistical Significance is used to evaluate the trend<br>over 4 to 10 periods of measure, subject to data availability and comparability.
Persons with an Ambulatory Difficulty Census Place: Albion
Persons with an Ambulatory Difficulty Census Place: Albion
7.5%
(2018-2022)
Compared to:
Calhoun, MI County Value
(7.6%)
The regional value is compared to the Calhoun County value.
MI Value
(7.2%)
The regional value is compared to the Michigan State value.
US Value
(6.7%)
The regional value is compared to the national value.
Trend
This comparison measures the indicator’s values over multiple time periods.<br>The Mann-Kendall Test for Statistical Significance is used to evaluate the trend<br>over 4 to 10 periods of measure, subject to data availability and comparability.
Adults who have had a Routine Checkup Census Place: Albion
Adults who have had a Routine Checkup Census Place: Albion
75.6%
(2021)
Compared to:
MI Census Places
The distribution is based on data from 690 locales.
U.S. Census Places
The distribution is based on data from 27,528 U.S. Census Places.
Calhoun, MI County Value
(76.7%)
The regional value is compared to the Calhoun County value.
US Value
(73.6%)
The regional value is compared to the national value.
Households with an Internet Subscription Census Place: Albion
Households with an Internet Subscription Census Place: Albion
85.2%
(2018-2022)
Compared to:
MI Census Places
The distribution is based on data from 690 locales.
U.S. Census Places
The distribution is based on data from 28,859 U.S. Census Places.
Calhoun, MI County Value
(87.2%)
The regional value is compared to the Calhoun County value.
MI Value
(88.0%)
The regional value is compared to the Michigan State value.
US Value
(88.5%)
The regional value is compared to the national value.
Trend
This comparison measures the indicator’s values over multiple time periods.<br>The Mann-Kendall Test for Statistical Significance is used to evaluate the trend<br>over 4 to 10 periods of measure, subject to data availability and comparability.
Persons with an Internet Subscription Census Place: Albion
Persons with an Internet Subscription Census Place: Albion
90.5%
(2018-2022)
Compared to:
MI Census Places
The distribution is based on data from 690 locales.
U.S. Census Places
The distribution is based on data from 28,859 U.S. Census Places.
Calhoun, MI County Value
(90.8%)
The regional value is compared to the Calhoun County value.
MI Value
(90.8%)
The regional value is compared to the Michigan State value.
US Value
(91.0%)
The regional value is compared to the national value.
Trend
This comparison measures the indicator’s values over multiple time periods.<br>The Mann-Kendall Test for Statistical Significance is used to evaluate the trend<br>over 4 to 10 periods of measure, subject to data availability and comparability.
Households with One or More Types of Computing Devices Census Place: Albion
Households with One or More Types of Computing Devices Census Place: Albion
90.1%
(2018-2022)
Compared to:
MI Census Places
The distribution is based on data from 690 locales.
U.S. Census Places
The distribution is based on data from 28,675 U.S. Census Places.
Calhoun, MI County Value
(91.9%)
The regional value is compared to the Calhoun County value.
MI Value
(93.4%)
The regional value is compared to the Michigan State value.
US Value
(94.0%)
The regional value is compared to the national value.
Trend
This comparison measures the indicator’s values over multiple time periods.<br>The Mann-Kendall Test for Statistical Significance is used to evaluate the trend<br>over 4 to 10 periods of measure, subject to data availability and comparability.
Adults who Experienced Coronary Heart Disease Census Place: Albion
Adults who Experienced Coronary Heart Disease Census Place: Albion
6.5%
(2021)
Compared to:
MI Census Places
The distribution is based on data from 690 locales.
U.S. Census Places
The distribution is based on data from 27,528 U.S. Census Places.
Calhoun, MI County Value
(7.3%)
The regional value is compared to the Calhoun County value.
US Value
(6.1%)
The regional value is compared to the national value.
Adults who Have Taken Medications for High Blood Pressure Census Place: Albion
Adults who Have Taken Medications for High Blood Pressure Census Place: Albion
77.5%
(2021)
Compared to:
MI Census Places
The distribution is based on data from 690 locales.
U.S. Census Places
The distribution is based on data from 27,528 U.S. Census Places.
Calhoun, MI County Value
(79.9%)
The regional value is compared to the Calhoun County value.
US Value
(78.2%)
The regional value is compared to the national value.
High Blood Pressure Prevalence Census Place: Albion
High Blood Pressure Prevalence Census Place: Albion
34.9%
(2021)
Compared to:
MI Census Places
The distribution is based on data from 690 locales.
U.S. Census Places
The distribution is based on data from 27,528 U.S. Census Places.
Calhoun, MI County Value
(37.5%)
The regional value is compared to the Calhoun County value.
US Value
(32.7%)
The regional value is compared to the national value.
HP 2030 Target
(41.9%)
High Cholesterol Prevalence: Past 5 Years Census Place: Albion
High Cholesterol Prevalence: Past 5 Years Census Place: Albion
32.3%
(2021)
Compared to:
MI Census Places
The distribution is based on data from 690 locales.
U.S. Census Places
The distribution is based on data from 27,528 U.S. Census Places.
Calhoun, MI County Value
(37.2%)
The regional value is compared to the Calhoun County value.
US Value
(36.4%)
The regional value is compared to the national value.
Cholesterol Test History Census Place: Albion
Cholesterol Test History Census Place: Albion
78.9%
(2021)
Compared to:
MI Census Places
The distribution is based on data from 690 locales.
U.S. Census Places
The distribution is based on data from 27,528 U.S. Census Places.
Calhoun, MI County Value
(85.4%)
The regional value is compared to the Calhoun County value.
US Value
(86.4%)
The regional value is compared to the national value.
Other Data Indicators
Adults 65+ who Received Recommended Preventive Services: Females
Value
Compared to:
Adults 65+ who Received Recommended Preventive Services: Females Census Place: Albion
Adults 65+ who Received Recommended Preventive Services: Females Census Place: Albion
33.5%
(2020)
Compared to:
MI Census Places
The distribution is based on data from 690 locales.
U.S. Census Places
The distribution is based on data from 28,400 U.S. Census Places.
Calhoun, MI County Value
(40.2%)
The regional value is compared to the Calhoun County value.
US Value
(37.9%)
The regional value is compared to the national value.
Other Data Indicators
Adults 65+ who Received Recommended Preventive Services: Males
Value
Compared to:
Adults 65+ who Received Recommended Preventive Services: Males Census Place: Albion
Adults 65+ who Received Recommended Preventive Services: Males Census Place: Albion
36.9%
(2020)
Compared to:
MI Census Places
The distribution is based on data from 690 locales.
U.S. Census Places
The distribution is based on data from 28,400 U.S. Census Places.
Calhoun, MI County Value
(42.3%)
The regional value is compared to the Calhoun County value.
US Value
(43.7%)
The regional value is compared to the national value.
Adults 65+ with a Disability Census Place: Albion
Adults 65+ with a Disability Census Place: Albion
33.6%
(2018-2022)
Compared to:
Calhoun, MI County Value
(33.8%)
The regional value is compared to the Calhoun County value.
MI Value
(32.7%)
The regional value is compared to the Michigan State value.
US Value
(33.3%)
The regional value is compared to the national value.
Trend
This comparison measures the indicator’s values over multiple time periods.<br>The Mann-Kendall Test for Statistical Significance is used to evaluate the trend<br>over 4 to 10 periods of measure, subject to data availability and comparability.
Adults 65+ with a Hearing Difficulty Census Place: Albion
Adults 65+ with a Hearing Difficulty Census Place: Albion
13.0%
(2018-2022)
Compared to:
Calhoun, MI County Value
(13.0%)
The regional value is compared to the Calhoun County value.
MI Value
(13.6%)
The regional value is compared to the Michigan State value.
US Value
(13.7%)
The regional value is compared to the national value.
Trend
This comparison measures the indicator’s values over multiple time periods.<br>The Mann-Kendall Test for Statistical Significance is used to evaluate the trend<br>over 4 to 10 periods of measure, subject to data availability and comparability.
Adults 65+ with a Self-Care Difficulty Census Place: Albion
Adults 65+ with a Self-Care Difficulty Census Place: Albion
6.6%
(2018-2022)
Compared to:
Calhoun, MI County Value
(7.0%)
The regional value is compared to the Calhoun County value.
MI Value
(6.8%)
The regional value is compared to the Michigan State value.
US Value
(7.4%)
The regional value is compared to the national value.
Trend
This comparison measures the indicator’s values over multiple time periods.<br>The Mann-Kendall Test for Statistical Significance is used to evaluate the trend<br>over 4 to 10 periods of measure, subject to data availability and comparability.
Adults 65+ with a Vision Difficulty Census Place: Albion
Adults 65+ with a Vision Difficulty Census Place: Albion
4.8%
(2018-2022)
Compared to:
Calhoun, MI County Value
(5.0%)
The regional value is compared to the Calhoun County value.
MI Value
(5.3%)
The regional value is compared to the Michigan State value.
US Value
(6.0%)
The regional value is compared to the national value.
Trend
This comparison measures the indicator’s values over multiple time periods.<br>The Mann-Kendall Test for Statistical Significance is used to evaluate the trend<br>over 4 to 10 periods of measure, subject to data availability and comparability.
Adults 65+ with an Independent Living Difficulty Census Place: Albion
Adults 65+ with an Independent Living Difficulty Census Place: Albion
8.4%
(2018-2022)
Compared to:
Calhoun, MI County Value
(13.3%)
The regional value is compared to the Calhoun County value.
MI Value
(13.1%)
The regional value is compared to the Michigan State value.
US Value
(13.6%)
The regional value is compared to the national value.
Trend
This comparison measures the indicator’s values over multiple time periods.<br>The Mann-Kendall Test for Statistical Significance is used to evaluate the trend<br>over 4 to 10 periods of measure, subject to data availability and comparability.
Adults who Visited a Dentist Census Place: Albion
Adults who Visited a Dentist Census Place: Albion
59.0%
(2020)
Compared to:
MI Census Places
The distribution is based on data from 690 locales.
U.S. Census Places
The distribution is based on data from 28,438 U.S. Census Places.
Calhoun, MI County Value
(64.1%)
The regional value is compared to the Calhoun County value.
US Value
(64.8%)
The regional value is compared to the national value.
Adults with Arthritis Census Place: Albion
Adults with Arthritis Census Place: Albion
26.4%
(2021)
Compared to:
MI Census Places
The distribution is based on data from 690 locales.
U.S. Census Places
The distribution is based on data from 27,528 U.S. Census Places.
Calhoun, MI County Value
(31.1%)
The regional value is compared to the Calhoun County value.
US Value
(25.2%)
The regional value is compared to the national value.
Adults who are Sedentary Census Place: Albion
Adults who are Sedentary Census Place: Albion
29.2%
(2021)
Compared to:
MI Census Places
The distribution is based on data from 690 locales.
U.S. Census Places
The distribution is based on data from 27,528 U.S. Census Places.
US Value
(23.7%)
The regional value is compared to the national value.
HP 2030 Target
(21.8%)
Adults with COPD Census Place: Albion
Adults with COPD Census Place: Albion
8.2%
Percent of adults
(2021)
Compared to:
MI Census Places
The distribution is based on data from 690 locales.
U.S. Census Places
The distribution is based on data from 27,528 U.S. Census Places.
Calhoun, MI County Value
(8.5%)
The regional value is compared to the Calhoun County value.
US Value
(6.4%)
The regional value is compared to the national value.
Adults with Current Asthma Census Place: Albion
Adults with Current Asthma Census Place: Albion
12.8%
(2021)
Compared to:
MI Census Places
The distribution is based on data from 690 locales.
U.S. Census Places
The distribution is based on data from 27,528 U.S. Census Places.
Calhoun, MI County Value
(11.3%)
The regional value is compared to the Calhoun County value.
US Value
(9.7%)
The regional value is compared to the national value.
Adults who Smoke Census Place: Albion
Adults who Smoke Census Place: Albion
19.8%
(2021)
Compared to:
MI Census Places
The distribution is based on data from 690 locales.
U.S. Census Places
The distribution is based on data from 27,528 U.S. Census Places.
Calhoun, MI County Value
(19.0%)
The regional value is compared to the Calhoun County value.
US Value
(13.5%)
The regional value is compared to the national value.
HP 2030 Target
(6.1%)
<div>TU-02: Reduce current cigarette smoking in adults <strong>(LEADING HEALTH INDICATOR)</strong></div>
Adults Who Are Obese Census Place: Albion
Adults Who Are Obese Census Place: Albion
40.9%
(2021)
Compared to:
MI Census Places
The distribution is based on data from 690 locales.
U.S. Census Places
The distribution is based on data from 27,528 U.S. Census Places.
US Value
(33.0%)
The regional value is compared to the national value.
Insufficient Sleep Census Place: Albion
Insufficient Sleep Census Place: Albion
38.0%
(2020)
Compared to:
MI Census Places
The distribution is based on data from 690 locales.
U.S. Census Places
The distribution is based on data from 28,438 U.S. Census Places.
Calhoun, MI County Value
(35.9%)
The regional value is compared to the Calhoun County value.
US Value
(32.7%)
The regional value is compared to the national value.
HP 2030 Target
(26.7%)
Poor Physical Health: 14+ Days Census Place: Albion
Poor Physical Health: 14+ Days Census Place: Albion
13.1%
(2021)
Compared to:
MI Census Places
The distribution is based on data from 690 locales.
U.S. Census Places
The distribution is based on data from 27,528 U.S. Census Places.
Calhoun, MI County Value
(12.8%)
The regional value is compared to the Calhoun County value.
US Value
(10.9%)
The regional value is compared to the national value.
Self-Reported General Health Assessment: Poor or Fair Census Place: Albion
Self-Reported General Health Assessment: Poor or Fair Census Place: Albion
21.3%
(2021)
Compared to:
MI Census Places
The distribution is based on data from 690 locales.
U.S. Census Places
The distribution is based on data from 27,528 U.S. Census Places.
Calhoun, MI County Value
(18.7%)
The regional value is compared to the Calhoun County value.
US Value
(16.1%)
The regional value is compared to the national value.
Average Household Size Census Place: Albion
Average Household Size Census Place: Albion
2.60
Persons per household
(2018-2022)
Compared to:

Calhoun, MI County Value
(2.50)
The regional value is compared to the Calhoun County value.
MI Value
(2.50)
The regional value is compared to the Michigan State value.
US Value
(2.60)
The regional value is compared to the national value.
Trend
This comparison measures the indicator’s values over multiple time periods.<br>The Mann-Kendall Test for Statistical Significance is used to evaluate the trend<br>over 4 to 10 periods of measure, subject to data availability and comparability.
Foreign Born Persons Census Place: Albion
Foreign Born Persons Census Place: Albion
0.7%
(2018-2022)
Compared to:
Calhoun, MI County Value
(4.1%)
The regional value is compared to the Calhoun County value.
MI Value
(6.9%)
The regional value is compared to the Michigan State value.
US Value
(13.7%)
The regional value is compared to the national value.
Total Population Census Place: Albion
Total Population Census Place: Albion
8,402
People
(2019)
Compared to:


Prior Value
(8,477)
Prior Value compares a measured value with the previously measured value. Confidence intervals were not taken into account in determining the direction of the comparison.
Trend
This comparison measures the indicator’s values over multiple time periods.<br>The Mann-Kendall Test for Statistical Significance is used to evaluate the trend<br>over 4 to 10 periods of measure, subject to data availability and comparability.
Veteran Population Census Place: Albion
Veteran Population Census Place: Albion
3.4%
(2018-2022)
Compared to:
Calhoun, MI County Value
(7.9%)
The regional value is compared to the Calhoun County value.
MI Value
(6.3%)
The regional value is compared to the Michigan State value.
US Value
(6.6%)
The regional value is compared to the national value.
Trend
This comparison measures the indicator’s values over multiple time periods.<br>The Mann-Kendall Test for Statistical Significance is used to evaluate the trend<br>over 4 to 10 periods of measure, subject to data availability and comparability.
Children in Single-Parent Households Census Place: Albion
Children in Single-Parent Households Census Place: Albion
55.0%
(2018-2022)
Compared to:

MI Census Places
The distribution is based on data from 682 locales.
U.S. Census Places
The distribution is based on data from 27,568 U.S. Census Places.
Calhoun, MI County Value
(32.5%)
The regional value is compared to the Calhoun County value.
MI Value
(25.2%)
The regional value is compared to the Michigan State value.
US Value
(24.9%)
The regional value is compared to the national value.
Trend
This comparison measures the indicator’s values over multiple time periods.<br>The Mann-Kendall Test for Statistical Significance is used to evaluate the trend<br>over 4 to 10 periods of measure, subject to data availability and comparability.
People 65+ Living Alone Census Place: Albion
People 65+ Living Alone Census Place: Albion
31.3%
(2018-2022)
Compared to:
MI Census Places
The distribution is based on data from 688 locales.
U.S. Census Places
The distribution is based on data from 28,328 U.S. Census Places.
Calhoun, MI County Value
(28.4%)
The regional value is compared to the Calhoun County value.
MI Value
(28.4%)
The regional value is compared to the Michigan State value.
US Value
(26.4%)
The regional value is compared to the national value.
Trend
This comparison measures the indicator’s values over multiple time periods.<br>The Mann-Kendall Test for Statistical Significance is used to evaluate the trend<br>over 4 to 10 periods of measure, subject to data availability and comparability.
Households without a Vehicle Census Place: Albion
Households without a Vehicle Census Place: Albion
8.9%
(2018-2022)
Compared to:
MI Census Places
The distribution is based on data from 690 locales.
U.S. Census Places
The distribution is based on data from 28,859 U.S. Census Places.
Calhoun, MI County Value
(7.4%)
The regional value is compared to the Calhoun County value.
MI Value
(7.2%)
The regional value is compared to the Michigan State value.
US Value
(8.3%)
The regional value is compared to the national value.
Trend
This comparison measures the indicator’s values over multiple time periods.<br>The Mann-Kendall Test for Statistical Significance is used to evaluate the trend<br>over 4 to 10 periods of measure, subject to data availability and comparability.
Mean Travel Time to Work Census Place: Albion
Mean Travel Time to Work Census Place: Albion
22.5
Minutes
(2018-2022)
Compared to:

MI Census Places
The distribution is based on data from 679 locales.
U.S. Census Places
The distribution is based on data from 26,325 U.S. Census Places.
Calhoun, MI County Value
(20.6)
The regional value is compared to the Calhoun County value.
MI Value
(24.5)
The regional value is compared to the Michigan State value.
US Value
(26.7)
The regional value is compared to the national value.
Trend
This comparison measures the indicator’s values over multiple time periods.<br>The Mann-Kendall Test for Statistical Significance is used to evaluate the trend<br>over 4 to 10 periods of measure, subject to data availability and comparability.
Workers Commuting by Public Transportation Census Place: Albion
Workers Commuting by Public Transportation Census Place: Albion
0.7%
(2018-2022)
Compared to:
Calhoun, MI County Value
(0.8%)
The regional value is compared to the Calhoun County value.
MI Value
(1.1%)
The regional value is compared to the Michigan State value.
US Value
(3.8%)
The regional value is compared to the national value.
Trend
This comparison measures the indicator’s values over multiple time periods.<br>The Mann-Kendall Test for Statistical Significance is used to evaluate the trend<br>over 4 to 10 periods of measure, subject to data availability and comparability.
HP 2030 Target
(5.3%)
Workers who Drive Alone to Work Census Place: Albion
Workers who Drive Alone to Work Census Place: Albion
71.6%
(2018-2022)
Compared to:
MI Census Places
The distribution is based on data from 690 locales.
U.S. Census Places
The distribution is based on data from 28,625 U.S. Census Places.
Calhoun, MI County Value
(80.8%)
The regional value is compared to the Calhoun County value.
MI Value
(77.1%)
The regional value is compared to the Michigan State value.
US Value
(71.7%)
The regional value is compared to the national value.
Trend
This comparison measures the indicator’s values over multiple time periods.<br>The Mann-Kendall Test for Statistical Significance is used to evaluate the trend<br>over 4 to 10 periods of measure, subject to data availability and comparability.
Female Population 16+ in Civilian Labor Force Census Place: Albion
Female Population 16+ in Civilian Labor Force Census Place: Albion
47.8%
(2018-2022)
Compared to:

MI Census Places
The distribution is based on data from 690 locales.
U.S. Census Places
The distribution is based on data from 28,799 U.S. Census Places.
Calhoun, MI County Value
(56.6%)
The regional value is compared to the Calhoun County value.
MI Value
(57.1%)
The regional value is compared to the Michigan State value.
US Value
(58.5%)
The regional value is compared to the national value.
Trend
This comparison measures the indicator’s values over multiple time periods.<br>The Mann-Kendall Test for Statistical Significance is used to evaluate the trend<br>over 4 to 10 periods of measure, subject to data availability and comparability.
Population 16+ in Civilian Labor Force Census Place: Albion
Population 16+ in Civilian Labor Force Census Place: Albion
44.3%
(2018-2022)
Compared to:

MI Census Places
The distribution is based on data from 690 locales.
U.S. Census Places
The distribution is based on data from 28,884 U.S. Census Places.
Calhoun, MI County Value
(55.5%)
The regional value is compared to the Calhoun County value.
MI Value
(57.7%)
The regional value is compared to the Michigan State value.
US Value
(59.6%)
The regional value is compared to the national value.
Trend
This comparison measures the indicator’s values over multiple time periods.<br>The Mann-Kendall Test for Statistical Significance is used to evaluate the trend<br>over 4 to 10 periods of measure, subject to data availability and comparability.
Households Receiving SNAP with Children Census Place: Albion
Households Receiving SNAP with Children Census Place: Albion
47.2%
(2018-2022)
Compared to:
Calhoun, MI County Value
(41.0%)
The regional value is compared to the Calhoun County value.
MI Value
(43.0%)
The regional value is compared to the Michigan State value.
US Value
(47.9%)
The regional value is compared to the national value.
Trend
This comparison measures the indicator’s values over multiple time periods.<br>The Mann-Kendall Test for Statistical Significance is used to evaluate the trend<br>over 4 to 10 periods of measure, subject to data availability and comparability.
Households with Cash Public Assistance Income Census Place: Albion
Households with Cash Public Assistance Income Census Place: Albion
3.1%
(2018-2022)
Compared to:
MI Census Places
The distribution is based on data from 383 locales.
U.S. Census Places
The distribution is based on data from 28,859 U.S. Census Places.
Calhoun, MI County Value
(1.9%)
The regional value is compared to the Calhoun County value.
MI Value
(2.8%)
The regional value is compared to the Michigan State value.
US Value
(2.7%)
The regional value is compared to the national value.
Trend
This comparison measures the indicator’s values over multiple time periods.<br>The Mann-Kendall Test for Statistical Significance is used to evaluate the trend<br>over 4 to 10 periods of measure, subject to data availability and comparability.
Homeowner Vacancy Rate Census Place: Albion
Homeowner Vacancy Rate Census Place: Albion
5.0%
(2018-2022)
Compared to:
MI Census Places
(2016-2020)
The distribution is based on data from 690 locales.
U.S. Census Places
(2013-2017)
The distribution is based on data from 28,912 U.S. Census Places.
Calhoun, MI County Value
(1.3%)
The regional value is compared to the Calhoun County value.
MI Value
(1.0%)
The regional value is compared to the Michigan State value.
US Value
(1.1%)
The regional value is compared to the national value.
Trend
This comparison measures the indicator’s values over multiple time periods.<br>The Mann-Kendall Test for Statistical Significance is used to evaluate the trend<br>over 4 to 10 periods of measure, subject to data availability and comparability.
Homeownership Census Place: Albion
Homeownership Census Place: Albion
46.5%
(2018-2022)
Compared to:
MI Census Places
The distribution is based on data from 691 locales.
U.S. Census Places
The distribution is based on data from 28,990 U.S. Census Places.
Calhoun, MI County Value
(63.8%)
The regional value is compared to the Calhoun County value.
MI Value
(63.5%)
The regional value is compared to the Michigan State value.
US Value
(57.8%)
The regional value is compared to the national value.
Trend
This comparison measures the indicator’s values over multiple time periods.<br>The Mann-Kendall Test for Statistical Significance is used to evaluate the trend<br>over 4 to 10 periods of measure, subject to data availability and comparability.
Median Household Gross Rent Census Place: Albion
Median Household Gross Rent Census Place: Albion
$788
(2018-2022)
Compared to:
MI Census Places
The distribution is based on data from 597 locales.
Calhoun, MI County Value
($897)
The regional value is compared to the Calhoun County value.
MI Value
($1,037)
The regional value is compared to the Michigan State value.
US Value
($1,268)
The regional value is compared to the national value.
Trend
This comparison measures the indicator’s values over multiple time periods.<br>The Mann-Kendall Test for Statistical Significance is used to evaluate the trend<br>over 4 to 10 periods of measure, subject to data availability and comparability.
Mortgaged Owners Median Monthly Household Costs Census Place: Albion
Mortgaged Owners Median Monthly Household Costs Census Place: Albion
$999
(2018-2022)
Compared to:
MI Census Places
The distribution is based on data from 672 locales.
Calhoun, MI County Value
($1,211)
The regional value is compared to the Calhoun County value.
MI Value
($1,472)
The regional value is compared to the Michigan State value.
US Value
($1,828)
The regional value is compared to the national value.
Trend
This comparison measures the indicator’s values over multiple time periods.<br>The Mann-Kendall Test for Statistical Significance is used to evaluate the trend<br>over 4 to 10 periods of measure, subject to data availability and comparability.
Renters Spending 30% or More of Household Income on Rent Census Place: Albion
Renters Spending 30% or More of Household Income on Rent Census Place: Albion
60.7%
(2018-2022)
Compared to:
MI Census Places
The distribution is based on data from 670 locales.
U.S. Census Places
The distribution is based on data from 26,241 U.S. Census Places.
Calhoun, MI County Value
(46.0%)
The regional value is compared to the Calhoun County value.
MI Value
(49.0%)
The regional value is compared to the Michigan State value.
US Value
(49.9%)
The regional value is compared to the national value.
Trend
This comparison measures the indicator’s values over multiple time periods.<br>The Mann-Kendall Test for Statistical Significance is used to evaluate the trend<br>over 4 to 10 periods of measure, subject to data availability and comparability.
HP 2030 Target
(25.5%)
Overcrowded Households Census Place: Albion
Overcrowded Households Census Place: Albion
1.4%
(2018-2022)
Compared to:
MI Census Places
The distribution is based on data from 690 locales.
Calhoun, MI County Value
(1.3%)
The regional value is compared to the Calhoun County value.
MI Value
(1.6%)
The regional value is compared to the Michigan State value.
US Value
(3.4%)
The regional value is compared to the national value.
Other Data Indicators
Households that are Above the Asset Limited, Income Constrained, Employed (ALICE) Threshold
Value
Compared to:
Households that are Above the Asset Limited, Income Constrained, Employed (ALICE) Threshold Census Place: Albion
Households that are Above the Asset Limited, Income Constrained, Employed (ALICE) Threshold Census Place: Albion
41.3%
(2021)
Compared to:

MI Counties
The distribution is based on data from 83 Michigan counties.
MI Census Places
The distribution is based on data from 627 locales.
Calhoun, MI County Value
(57.9%)
The regional value is compared to the Calhoun County value.
MI Value
(61.0%)
The regional value is compared to the Michigan State value.
Prior Value
(43.0%)
Prior Value compares a measured value with the previously measured value. Confidence intervals were not taken into account in determining the direction of the comparison.
Other Data Indicators
Households that are Asset Limited, Income Constrained, Employed (ALICE)
Value
Compared to:
Households that are Asset Limited, Income Constrained, Employed (ALICE) Census Place: Albion
Households that are Asset Limited, Income Constrained, Employed (ALICE) Census Place: Albion
33.4%
(2021)
Compared to:

MI Counties
The distribution is based on data from 83 Michigan counties.
MI Census Places
The distribution is based on data from 627 locales.
Calhoun, MI County Value
(29.7%)
The regional value is compared to the Calhoun County value.
MI Value
(26.0%)
The regional value is compared to the Michigan State value.
Prior Value
(31.8%)
Prior Value compares a measured value with the previously measured value. Confidence intervals were not taken into account in determining the direction of the comparison.
Trend
This comparison measures the indicator’s values over multiple time periods.<br>The Mann-Kendall Test for Statistical Significance is used to evaluate the trend<br>over 4 to 10 periods of measure, subject to data availability and comparability.
Income Inequality Census Place: Albion
Income Inequality Census Place: Albion
0.461
(2018-2022)
Compared to:
MI Census Places
The distribution is based on data from 690 locales.
U.S. Census Places
The distribution is based on data from 28,505 U.S. Census Places.
Calhoun, MI County Value
(0.444)
The regional value is compared to the Calhoun County value.
MI Value
(0.464)
The regional value is compared to the Michigan State value.
US Value
(0.483)
The regional value is compared to the national value.
Trend
This comparison measures the indicator’s values over multiple time periods.<br>The Mann-Kendall Test for Statistical Significance is used to evaluate the trend<br>over 4 to 10 periods of measure, subject to data availability and comparability.
Median Household Income Census Place: Albion
Median Household Income Census Place: Albion
$41,594
(2018-2022)
Compared to:
MI Census Places
The distribution is based on data from 680 locales.
U.S. Census Places
The distribution is based on data from 26,419 U.S. Census Places.
Calhoun, MI County Value
($58,191)
The regional value is compared to the Calhoun County value.
MI Value
($68,505)
The regional value is compared to the Michigan State value.
US Value
($75,149)
The regional value is compared to the national value.
Trend
This comparison measures the indicator’s values over multiple time periods.<br>The Mann-Kendall Test for Statistical Significance is used to evaluate the trend<br>over 4 to 10 periods of measure, subject to data availability and comparability.
Per Capita Income Census Place: Albion
Per Capita Income Census Place: Albion
$18,850
(2018-2022)
Compared to:
MI Census Places
The distribution is based on data from 690 locales.
U.S. Census Places
The distribution is based on data from 28,512 U.S. Census Places.
Calhoun, MI County Value
($32,047)
The regional value is compared to the Calhoun County value.
MI Value
($37,929)
The regional value is compared to the Michigan State value.
US Value
($41,261)
The regional value is compared to the national value.
Trend
This comparison measures the indicator’s values over multiple time periods.<br>The Mann-Kendall Test for Statistical Significance is used to evaluate the trend<br>over 4 to 10 periods of measure, subject to data availability and comparability.
Families Living Below Poverty Level Census Place: Albion
Families Living Below Poverty Level Census Place: Albion
23.8%
(2018-2022)
Compared to:
MI Census Places
The distribution is based on data from 690 locales.
U.S. Census Places
The distribution is based on data from 28,635 U.S. Census Places.
Calhoun, MI County Value
(10.3%)
The regional value is compared to the Calhoun County value.
MI Value
(8.8%)
The regional value is compared to the Michigan State value.
US Value
(8.8%)
The regional value is compared to the national value.
Trend
This comparison measures the indicator’s values over multiple time periods.<br>The Mann-Kendall Test for Statistical Significance is used to evaluate the trend<br>over 4 to 10 periods of measure, subject to data availability and comparability.
Households Living Below Poverty Level Census Place: Albion
Households Living Below Poverty Level Census Place: Albion
25.3%
(2021)
Compared to:
MI Counties
The distribution is based on data from 83 Michigan counties.
MI Census Places
The distribution is based on data from 627 locales.
Calhoun, MI County Value
(12.3%)
The regional value is compared to the Calhoun County value.
MI Value
(13.0%)
The regional value is compared to the Michigan State value.
Prior Value
(25.1%)
Prior Value compares a measured value with the previously measured value. Confidence intervals were not taken into account in determining the direction of the comparison.
People 65+ Living Below Poverty Level Census Place: Albion
People 65+ Living Below Poverty Level Census Place: Albion
13.2%
(2018-2022)
Compared to:
MI Census Places
The distribution is based on data from 688 locales.
U.S. Census Places
The distribution is based on data from 28,319 U.S. Census Places.
Calhoun, MI County Value
(10.2%)
The regional value is compared to the Calhoun County value.
MI Value
(9.0%)
The regional value is compared to the Michigan State value.
US Value
(10.0%)
The regional value is compared to the national value.
Trend
This comparison measures the indicator’s values over multiple time periods.<br>The Mann-Kendall Test for Statistical Significance is used to evaluate the trend<br>over 4 to 10 periods of measure, subject to data availability and comparability.
People Living 200% Above Poverty Level Census Place: Albion
People Living 200% Above Poverty Level Census Place: Albion
44.3%
(2018-2022)
Compared to:
MI Census Places
The distribution is based on data from 690 locales.
U.S. Census Places
The distribution is based on data from 28,869 U.S. Census Places.
Calhoun, MI County Value
(64.5%)
The regional value is compared to the Calhoun County value.
MI Value
(70.5%)
The regional value is compared to the Michigan State value.
US Value
(71.2%)
The regional value is compared to the national value.
Trend
This comparison measures the indicator’s values over multiple time periods.<br>The Mann-Kendall Test for Statistical Significance is used to evaluate the trend<br>over 4 to 10 periods of measure, subject to data availability and comparability.
People Living Below Poverty Level Census Place: Albion
People Living Below Poverty Level Census Place: Albion
26.7%
(2018-2022)
Compared to:
MI Census Places
The distribution is based on data from 690 locales.
U.S. Census Places
The distribution is based on data from 28,869 U.S. Census Places.
Calhoun, MI County Value
(14.8%)
The regional value is compared to the Calhoun County value.
MI Value
(13.1%)
The regional value is compared to the Michigan State value.
US Value
(12.5%)
The regional value is compared to the national value.
Trend
This comparison measures the indicator’s values over multiple time periods.<br>The Mann-Kendall Test for Statistical Significance is used to evaluate the trend<br>over 4 to 10 periods of measure, subject to data availability and comparability.
HP 2030 Target
(8.0%)
Young Children Living Below Poverty Level Census Place: Albion
Young Children Living Below Poverty Level Census Place: Albion
36.7%
(2018-2022)
Compared to:
MI Census Places
The distribution is based on data from 647 locales.
U.S. Census Places
The distribution is based on data from 25,402 U.S. Census Places.
Calhoun, MI County Value
(29.0%)
The regional value is compared to the Calhoun County value.
MI Value
(20.1%)
The regional value is compared to the Michigan State value.
US Value
(18.1%)
The regional value is compared to the national value.
Trend
This comparison measures the indicator’s values over multiple time periods.<br>The Mann-Kendall Test for Statistical Significance is used to evaluate the trend<br>over 4 to 10 periods of measure, subject to data availability and comparability.
Youth not in School or Working Census Place: Albion
Youth not in School or Working Census Place: Albion
0.0%
(2018-2022)
Compared to:
MI Census Places
(2017-2021)
The distribution is based on data from 662 locales.
U.S. Census Places
(2015-2019)
The distribution is based on data from 26,145 U.S. Census Places.
Calhoun, MI County Value
(1.1%)
The regional value is compared to the Calhoun County value.
MI Value
(2.0%)
The regional value is compared to the Michigan State value.
US Value
(1.8%)
The regional value is compared to the national value.
Trend
This comparison measures the indicator’s values over multiple time periods.<br>The Mann-Kendall Test for Statistical Significance is used to evaluate the trend<br>over 4 to 10 periods of measure, subject to data availability and comparability.
People 25+ with a High School Diploma or Higher Census Place: Albion
People 25+ with a High School Diploma or Higher Census Place: Albion
89.0%
(2018-2022)
Compared to:
MI Census Places
The distribution is based on data from 690 locales.
U.S. Census Places
The distribution is based on data from 28,880 U.S. Census Places.
Calhoun, MI County Value
(91.1%)
The regional value is compared to the Calhoun County value.
MI Value
(91.8%)
The regional value is compared to the Michigan State value.
US Value
(89.1%)
The regional value is compared to the national value.
Trend
This comparison measures the indicator’s values over multiple time periods.<br>The Mann-Kendall Test for Statistical Significance is used to evaluate the trend<br>over 4 to 10 periods of measure, subject to data availability and comparability.
People 25+ with a Bachelor's Degree or Higher Census Place: Albion
People 25+ with a Bachelor's Degree or Higher Census Place: Albion
18.4%
(2018-2022)
Compared to:
MI Census Places
The distribution is based on data from 690 locales.
U.S. Census Places
The distribution is based on data from 28,880 U.S. Census Places.
Calhoun, MI County Value
(22.0%)
The regional value is compared to the Calhoun County value.
MI Value
(31.1%)
The regional value is compared to the Michigan State value.
US Value
(34.3%)
The regional value is compared to the national value.
Trend
This comparison measures the indicator’s values over multiple time periods.<br>The Mann-Kendall Test for Statistical Significance is used to evaluate the trend<br>over 4 to 10 periods of measure, subject to data availability and comparability.
Houses Built Prior to 1950 Census Place: Albion
Houses Built Prior to 1950 Census Place: Albion
58.7%
(2018-2022)
Compared to:
MI Census Places
The distribution is based on data from 691 locales.
U.S. Census Places
The distribution is based on data from 28,990 U.S. Census Places.
Calhoun, MI County Value
(32.9%)
The regional value is compared to the Calhoun County value.
MI Value
(21.6%)
The regional value is compared to the Michigan State value.
US Value
(16.7%)
The regional value is compared to the national value.
Trend
This comparison measures the indicator’s values over multiple time periods.<br>The Mann-Kendall Test for Statistical Significance is used to evaluate the trend<br>over 4 to 10 periods of measure, subject to data availability and comparability.
