
Search for Indicators
Maternal, Fetal & Infant Health
Indicator Gauge Icon Legend
Legend Colors
Red is bad, green is good, blue is not statistically different/neutral.
Compared to Distribution
 the value is in the best half of communities.
 the value is in the 2nd worst quarter of communities.
 the value is in the worst quarter of communities.
Compared to Target
 meets target;
  does not meet target.
Compared to a Single Value
 lower than the comparison value;
 higher than the comparison value;
 not statistically different from comparison value.
Trend

 non-significant change over time;
 significant change over time;
  no change over time.
Compared to Prior Value
 higher than the previous measurement period;
 lower than the previous measurement period;
 no statistically different change from previous measurement period.
County: Calhoun
Health / Family Planning
Value
Compared to:
County: Calhoun Teen Birth Rate: 15-19
County: Calhoun Teen Birth Rate: 15-19
22.8
Live births per 1,000 females aged 15-19
(2022)
Compared to:


MI Value
(11.5)
The regional value is compared to the Michigan State value.
US Value
(13.9 in 2021)
The regional value is compared to the national value. The source for the national value is Centers for Disease Control and Prevention, National Center for Health Statistics
Prior Value
(20.1)
Prior Value compares a measured value with the previously measured value. Confidence intervals were not taken into account in determining the direction of the comparison.
Trend
This comparison measures the indicator’s values over multiple time periods.<br>The Mann-Kendall Test for Statistical Significance is used to evaluate the trend<br>over 4 to 10 periods of measure, subject to data availability and comparability.
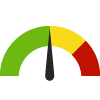
County: Calhoun Teen Pregnancy Rate
County: Calhoun Teen Pregnancy Rate
35.2
Pregnancies per 1,000 females aged 15-19
(2022)
Compared to:

MI Counties
The distribution is based on data from 74 Michigan counties.
MI Value
(21.2)
The regional value is compared to the Michigan State value.
Prior Value
(32.1)
Prior Value compares a measured value with the previously measured value. Confidence intervals were not taken into account in determining the direction of the comparison.
Trend
This comparison measures the indicator’s values over multiple time periods.<br>The Mann-Kendall Test for Statistical Significance is used to evaluate the trend<br>over 4 to 10 periods of measure, subject to data availability and comparability.
HP 2030 Target
(31.4)
County: Calhoun
Health / Maternal, Fetal & Infant Health
Value
Compared to:
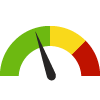
County: Calhoun Babies with Low Birthweight
County: Calhoun Babies with Low Birthweight
9.1%
(2022)
Compared to:


MI Counties
The distribution is based on data from 72 Michigan counties.
MI Value
(9.2%)
The regional value is compared to the Michigan State value.
US Value
(8.5% in 2021)
The regional value is compared to the national value. The source for the national value is Centers for Disease Control and Prevention
Prior Value
(8.9%)
Prior Value compares a measured value with the previously measured value. Confidence intervals were not taken into account in determining the direction of the comparison.
Trend
This comparison measures the indicator’s values over multiple time periods.<br>The Mann-Kendall Test for Statistical Significance is used to evaluate the trend<br>over 4 to 10 periods of measure, subject to data availability and comparability.
County: Calhoun Infant Mortality Rate: 3 year rate
County: Calhoun Infant Mortality Rate: 3 year rate
6.5
Deaths per 1,000 live births
(2020-2022)
Compared to:
MI Value
(6.5)
The regional value is compared to the Michigan State value.
US Value
(5.5 in 2019-2021)
The regional value is compared to the national value. The source for the national value is Centers for Disease Control and Prevention
Prior Value
(5.1)
Prior Value compares a measured value with the previously measured value. Confidence intervals were taken into account in determining the direction of the comparison.
Trend
This comparison measures the indicator’s values over multiple time periods.<br>The Mann-Kendall Test for Statistical Significance is used to evaluate the trend<br>over 4 to 10 periods of measure, subject to data availability and comparability.
HP 2030 Target
(5.0)
<div>MICH-02: Reduce the rate of infant deaths <strong>(LEADING HEALTH INDICATOR)</strong></div>
County: Calhoun Infant Mortality Rate: 5 year rate
County: Calhoun Infant Mortality Rate: 5 year rate
5.7
Deaths per 1,000 live births
(2018-2022)
Compared to:
MI Counties
The distribution is based on data from 53 Michigan counties.
MI Value
(6.5)
The regional value is compared to the Michigan State value.
US Value
(5.4 in 2021)
The regional value is compared to the national value. The source for the national value is Centers for Disease Control and Prevention
Prior Value
(6.5)
Prior Value compares a measured value with the previously measured value. Confidence intervals were taken into account in determining the direction of the comparison.
Trend
This comparison measures the indicator’s values over multiple time periods.<br>The Mann-Kendall Test for Statistical Significance is used to evaluate the trend<br>over 4 to 10 periods of measure, subject to data availability and comparability.
HP 2030 Target
(5.0)
<div>MICH-02: Reduce the rate of infant deaths <strong>(LEADING HEALTH INDICATOR)</strong></div>
County: Calhoun Mothers who Received Early Prenatal Care
County: Calhoun Mothers who Received Early Prenatal Care
69.3%
(2022)
Compared to:


MI Counties
The distribution is based on data from 83 Michigan counties.
MI Value
(76.3%)
The regional value is compared to the Michigan State value.
US Value
(78.3% in 2021)
The regional value is compared to the national value. The source for the national value is Centers for Disease Control and Prevention
Prior Value
(61.2%)
Prior Value compares a measured value with the previously measured value. Confidence intervals were not taken into account in determining the direction of the comparison.
Trend
This comparison measures the indicator’s values over multiple time periods.<br>The Mann-Kendall Test for Statistical Significance is used to evaluate the trend<br>over 4 to 10 periods of measure, subject to data availability and comparability.
County: Calhoun Mothers who Smoked During Pregnancy
County: Calhoun Mothers who Smoked During Pregnancy
11.9%
(2022)
Compared to:
MI Counties
The distribution is based on data from 82 Michigan counties.
MI Value
(8.5%)
The regional value is compared to the Michigan State value.
US Value
(4.6% in 2021)
The regional value is compared to the national value. The source for the national value is Centers for Disease Control and Prevention
Prior Value
(16.9%)
Prior Value compares a measured value with the previously measured value. Confidence intervals were not taken into account in determining the direction of the comparison.
Trend
This comparison measures the indicator’s values over multiple time periods.<br>The Mann-Kendall Test for Statistical Significance is used to evaluate the trend<br>over 4 to 10 periods of measure, subject to data availability and comparability.
HP 2030 Target
(4.3%)
County: Calhoun Mothers with Gestational Diabetes
County: Calhoun Mothers with Gestational Diabetes
8.4%
(2022)
Compared to:

MI Value
(7.3%)
The regional value is compared to the Michigan State value.
Prior Value
(9.4%)
Prior Value compares a measured value with the previously measured value. Confidence intervals were not taken into account in determining the direction of the comparison.
Trend
This comparison measures the indicator’s values over multiple time periods.<br>The Mann-Kendall Test for Statistical Significance is used to evaluate the trend<br>over 4 to 10 periods of measure, subject to data availability and comparability.
County: Calhoun Mothers with Hypertension
County: Calhoun Mothers with Hypertension
14.8%
(2022)
Compared to:
MI Value
(12.3%)
The regional value is compared to the Michigan State value.
Prior Value
(11.5%)
Prior Value compares a measured value with the previously measured value. Confidence intervals were not taken into account in determining the direction of the comparison.
Trend
This comparison measures the indicator’s values over multiple time periods.<br>The Mann-Kendall Test for Statistical Significance is used to evaluate the trend<br>over 4 to 10 periods of measure, subject to data availability and comparability.
County: Calhoun Preterm Births
County: Calhoun Preterm Births
10.1%
(2022)
Compared to:
MI Counties
The distribution is based on data from 75 Michigan counties.
MI Value
(10.4%)
The regional value is compared to the Michigan State value.
US Value
(10.5% in 2021)
The regional value is compared to the national value. The source for the national value is Centers for Disease Control and Prevention
Prior Value
(9.2%)
Prior Value compares a measured value with the previously measured value. Confidence intervals were not taken into account in determining the direction of the comparison.
Trend
This comparison measures the indicator’s values over multiple time periods.<br>The Mann-Kendall Test for Statistical Significance is used to evaluate the trend<br>over 4 to 10 periods of measure, subject to data availability and comparability.
HP 2030 Target
(9.4%)
County: Calhoun
Health / Women's Health
Value
Compared to:
County: Calhoun Age-Adjusted Death Rate due to Breast Cancer
County: Calhoun Age-Adjusted Death Rate due to Breast Cancer
18.6
Deaths per 100,000 females
(2016-2020)
Compared to:

MI Counties
The distribution is based on data from 61 Michigan counties.
U.S. Counties
The distribution is based on data from 1,755 U.S. counties and county equivalents.
MI Value
(20.2)
The regional value is compared to the Michigan State value.
US Value
(19.6)
The regional value is compared to the national value.
Prior Value
(20.4)
Prior Value compares a measured value with the previously measured value. Confidence intervals were taken into account in determining the direction of the comparison.
Trend
This comparison measures the indicator’s values over multiple time periods.<br>The Mann-Kendall Test for Statistical Significance is used to evaluate the trend<br>over 4 to 10 periods of measure, subject to data availability and comparability.
HP 2030 Target
(15.3)
County: Calhoun Breast Cancer Incidence Rate
County: Calhoun Breast Cancer Incidence Rate
131.7
Cases per 100,000 females
(2016-2020)
Compared to:
MI Counties
The distribution is based on data from 82 Michigan counties.
U.S. Counties
The distribution is based on data from 2,478 U.S. counties and county equivalents.
MI Value
(122.7)
The regional value is compared to the Michigan State value.
US Value
(127.0)
The regional value is compared to the national value.
Prior Value
(124.7)
Prior Value compares a measured value with the previously measured value. Confidence intervals were taken into account in determining the direction of the comparison.
Trend
This comparison measures the indicator’s values over multiple time periods.<br>The Mann-Kendall Test for Statistical Significance is used to evaluate the trend<br>over 4 to 10 periods of measure, subject to data availability and comparability.
County: Calhoun Cervical Cancer Screening: 21-65
County: Calhoun Cervical Cancer Screening: 21-65
82.6%
(2020)
Compared to:
MI Counties
The distribution is based on data from 83 Michigan counties.
U.S. Counties
The distribution is based on data from 3,141 U.S. counties and county equivalents.
US Value
(82.8%)
The regional value is compared to the national value.
County: Calhoun Mammogram in Past 2 Years: 50-74
County: Calhoun Mammogram in Past 2 Years: 50-74
73.0%
(2020)
Compared to:

MI Counties
The distribution is based on data from 83 Michigan counties.
U.S. Counties
The distribution is based on data from 3,141 U.S. counties and county equivalents.
US Value
(78.2%)
The regional value is compared to the national value.
HP 2030 Target
(80.3%)
County: Calhoun Mammography Screening: Medicare Population
County: Calhoun Mammography Screening: Medicare Population
49.0%
(2022)
Compared to:

MI Counties
The distribution is based on data from 83 Michigan counties.
U.S. Counties
The distribution is based on data from 3,123 U.S. counties and county equivalents.
MI Value
(49.0%)
The regional value is compared to the Michigan State value.
US Value
(47.0%)
The regional value is compared to the national value.
Prior Value
(49.0%)
Prior Value compares a measured value with the previously measured value. Confidence intervals were not taken into account in determining the direction of the comparison.
Trend
This comparison measures the indicator’s values over multiple time periods.<br>The Mann-Kendall Test for Statistical Significance is used to evaluate the trend<br>over 4 to 10 periods of measure, subject to data availability and comparability.
County: Calhoun Pap Test in Past 3 Years
County: Calhoun Pap Test in Past 3 Years
79.1%
(2016-2018)
Compared to:
MI Value
(82.5%)
The regional value is compared to the Michigan State value.
Prior Value
(75.7%)
Prior Value compares a measured value with the previously measured value. Confidence intervals were taken into account in determining the direction of the comparison.
