
Search for Indicators
Opioid Epidemic
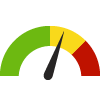
Indicator Gauge Icon Legend
Legend Colors
Red is bad, green is good, blue is not statistically different/neutral.
Compared to Distribution
 the value is in the best half of communities.
 the value is in the 2nd worst quarter of communities.
 the value is in the worst quarter of communities.
Compared to Target
 meets target;
  does not meet target.
Compared to a Single Value
 lower than the comparison value;
 higher than the comparison value;
 not statistically different from comparison value.
Trend

 non-significant change over time;
 significant change over time;
  no change over time.
Compared to Prior Value
 higher than the previous measurement period;
 lower than the previous measurement period;
 no statistically different change from previous measurement period.
 Significantly better than the overall value
 Significantly worse than the overall value
 Significantly different than the overall value
 No significant difference with the overall value
 No data on significance available
County: Calhoun
Value
Compared to:
County: Calhoun Death Rate due to Drug Poisoning
County: Calhoun Death Rate due to Drug Poisoning
47.8
Deaths per 100,000 population
(2021)
Compared to:


MI Counties
The distribution is based on data from 83 Michigan counties.
MI Value
(30.8)
The regional value is compared to the Michigan State value.
Prior Value
(42.7)
Prior Value compares a measured value with the previously measured value. Confidence intervals were not taken into account in determining the direction of the comparison.
Trend
This comparison measures the indicator’s values over multiple time periods.<br>The Mann-Kendall Test for Statistical Significance is used to evaluate the trend<br>over 4 to 10 periods of measure, subject to data availability and comparability.
HP 2030 Target
(20.7)
<div>SU-03: Reduce drug overdose deaths <strong>(LEADING HEALTH INDICATOR)</strong></div>
County: Calhoun Death Rate due to Opioid-Related Drug Poisoning
County: Calhoun Death Rate due to Opioid-Related Drug Poisoning
40.4
Deaths per 100,000 population
(2021)
Compared to:
MI Counties
The distribution is based on data from 83 Michigan counties.
MI Value
(25.3)
The regional value is compared to the Michigan State value.
Prior Value
(36.7)
Prior Value compares a measured value with the previously measured value. Confidence intervals were not taken into account in determining the direction of the comparison.
Trend
This comparison measures the indicator’s values over multiple time periods.<br>The Mann-Kendall Test for Statistical Significance is used to evaluate the trend<br>over 4 to 10 periods of measure, subject to data availability and comparability.
59
Deaths
(2021)
Compared to:

Prior Value
(52)
Prior Value compares a measured value with the previously measured value. Confidence intervals were not taken into account in determining the direction of the comparison.
Trend
This comparison measures the indicator’s values over multiple time periods.<br>The Mann-Kendall Test for Statistical Significance is used to evaluate the trend<br>over 4 to 10 periods of measure, subject to data availability and comparability.
County: Calhoun Age-Adjusted Drug and Opioid-Involved Overdose Death Rate
County: Calhoun Age-Adjusted Drug and Opioid-Involved Overdose Death Rate
39.4
Deaths per 100,000 population
(2018-2020)
Compared to:

MI Counties
The distribution is based on data from 44 Michigan counties.
U.S. Counties
The distribution is based on data from 1,303 U.S. counties and county equivalents.
MI Value
(26.5)
The regional value is compared to the Michigan State value.
US Value
(23.5)
The regional value is compared to the national value.
Prior Value
(38.2)
Prior Value compares a measured value with the previously measured value. Confidence intervals were taken into account in determining the direction of the comparison.
County: Calhoun Emergency Department Opioid Visits
County: Calhoun Emergency Department Opioid Visits
28.0
Visits
(July 2020)
Compared to:
Prior Value
(31.0)
Prior Value compares a measured value with the previously measured value. Confidence intervals were not taken into account in determining the direction of the comparison.
Trend
This comparison measures the indicator’s values over multiple time periods.<br>The Mann-Kendall Test for Statistical Significance is used to evaluate the trend<br>over 4 to 10 periods of measure, subject to data availability and comparability.
County: Calhoun Annual Emergency Department Opioid Visits
County: Calhoun Annual Emergency Department Opioid Visits
207.0
Visits
(2019)
Compared to:
Prior Value
(370.0)
Prior Value compares a measured value with the previously measured value. Confidence intervals were not taken into account in determining the direction of the comparison.
Trend
This comparison measures the indicator’s values over multiple time periods.<br>The Mann-Kendall Test for Statistical Significance is used to evaluate the trend<br>over 4 to 10 periods of measure, subject to data availability and comparability.
County: Calhoun Annual Opioid Hospitalizations
County: Calhoun Annual Opioid Hospitalizations
20
Hospitalizations
(2019)
Compared to:
Prior Value
(19)
Prior Value compares a measured value with the previously measured value. Confidence intervals were not taken into account in determining the direction of the comparison.
Trend
This comparison measures the indicator’s values over multiple time periods.<br>The Mann-Kendall Test for Statistical Significance is used to evaluate the trend<br>over 4 to 10 periods of measure, subject to data availability and comparability.
County: Calhoun Opioid Prescriptions Dispensed
County: Calhoun Opioid Prescriptions Dispensed
891,091.7
Prescriptions per 10,000 population
(2021)
Compared to:


MI Value
(663,067.3)
The regional value is compared to the Michigan State value.
Prior Value
(9,002.3)
Prior Value compares a measured value with the previously measured value. Confidence intervals were not taken into account in determining the direction of the comparison.
Trend
This comparison measures the indicator’s values over multiple time periods.<br>The Mann-Kendall Test for Statistical Significance is used to evaluate the trend<br>over 4 to 10 periods of measure, subject to data availability and comparability.
County: Calhoun
MiPHY Data
Value
Compared to:
County: Calhoun High School Students who Reported Using Heroin
County: Calhoun High School Students who Reported Using Heroin
0.0%
Percent of Students
(2021-2022 School Year)
Compared to:
Prior Value
(0.4%)
Prior Value compares a measured value with the previously measured value. Confidence intervals were not taken into account in determining the direction of the comparison.
Trend
This comparison measures the indicator’s values over multiple time periods.<br>The Mann-Kendall Test for Statistical Significance is used to evaluate the trend<br>over 4 to 10 periods of measure, subject to data availability and comparability.
87.0%
Percent of Students
(2021-2022 School Year)
Compared to:
Prior Value
(87.0%)
Prior Value compares a measured value with the previously measured value. Confidence intervals were not taken into account in determining the direction of the comparison.
Trend
This comparison measures the indicator’s values over multiple time periods.<br>The Mann-Kendall Test for Statistical Significance is used to evaluate the trend<br>over 4 to 10 periods of measure, subject to data availability and comparability.
96.5%
Percent of Students
(2021-2022 School Year)
Compared to:
Prior Value
(96.0%)
Prior Value compares a measured value with the previously measured value. Confidence intervals were not taken into account in determining the direction of the comparison.
Trend
This comparison measures the indicator’s values over multiple time periods.<br>The Mann-Kendall Test for Statistical Significance is used to evaluate the trend<br>over 4 to 10 periods of measure, subject to data availability and comparability.
72.2%
Percent of Students
(2021-2022 School Year)
Compared to:
Prior Value
(74.5%)
Prior Value compares a measured value with the previously measured value. Confidence intervals were not taken into account in determining the direction of the comparison.
Trend
This comparison measures the indicator’s values over multiple time periods.<br>The Mann-Kendall Test for Statistical Significance is used to evaluate the trend<br>over 4 to 10 periods of measure, subject to data availability and comparability.
4.5%
Percent of Students
(2021-2022 School Year)
Compared to:
Prior Value
(6.5%)
Prior Value compares a measured value with the previously measured value. Confidence intervals were not taken into account in determining the direction of the comparison.
Trend
This comparison measures the indicator’s values over multiple time periods.<br>The Mann-Kendall Test for Statistical Significance is used to evaluate the trend<br>over 4 to 10 periods of measure, subject to data availability and comparability.
2.4%
Percent of Students
(2021-2022 School Year)
Compared to:
Prior Value
(3.2%)
Prior Value compares a measured value with the previously measured value. Confidence intervals were not taken into account in determining the direction of the comparison.
Trend
This comparison measures the indicator’s values over multiple time periods.<br>The Mann-Kendall Test for Statistical Significance is used to evaluate the trend<br>over 4 to 10 periods of measure, subject to data availability and comparability.
89.7%
Percent of Students
(2021-2022 School Year)
Compared to:


Prior Value
(91.2%)
Prior Value compares a measured value with the previously measured value. Confidence intervals were not taken into account in determining the direction of the comparison.
Trend
This comparison measures the indicator’s values over multiple time periods.<br>The Mann-Kendall Test for Statistical Significance is used to evaluate the trend<br>over 4 to 10 periods of measure, subject to data availability and comparability.
96.4%
Percent of Students
(2021-2022 School Year)
Compared to:

Prior Value
(96.8%)
Prior Value compares a measured value with the previously measured value. Confidence intervals were not taken into account in determining the direction of the comparison.
Trend
This comparison measures the indicator’s values over multiple time periods.<br>The Mann-Kendall Test for Statistical Significance is used to evaluate the trend<br>over 4 to 10 periods of measure, subject to data availability and comparability.
61.2%
Percent of Students
(2021-2022 School Year)
Compared to:
Prior Value
(69.7%)
Prior Value compares a measured value with the previously measured value. Confidence intervals were not taken into account in determining the direction of the comparison.
Trend
This comparison measures the indicator’s values over multiple time periods.<br>The Mann-Kendall Test for Statistical Significance is used to evaluate the trend<br>over 4 to 10 periods of measure, subject to data availability and comparability.
7.2%
Percent of Students
(2021-2022 School Year)
Compared to:
Prior Value
(4.0%)
Prior Value compares a measured value with the previously measured value. Confidence intervals were not taken into account in determining the direction of the comparison.
Trend
This comparison measures the indicator’s values over multiple time periods.<br>The Mann-Kendall Test for Statistical Significance is used to evaluate the trend<br>over 4 to 10 periods of measure, subject to data availability and comparability.
4.1%
Percent of Students
(2021-2022 School Year)
Compared to:
Prior Value
(2.2%)
Prior Value compares a measured value with the previously measured value. Confidence intervals were not taken into account in determining the direction of the comparison.
Trend
This comparison measures the indicator’s values over multiple time periods.<br>The Mann-Kendall Test for Statistical Significance is used to evaluate the trend<br>over 4 to 10 periods of measure, subject to data availability and comparability.
5.3%
Percent of Students
(2021-2022 School Year)
Compared to:
Prior Value
(2.7%)
Prior Value compares a measured value with the previously measured value. Confidence intervals were not taken into account in determining the direction of the comparison.
Trend
This comparison measures the indicator’s values over multiple time periods.<br>The Mann-Kendall Test for Statistical Significance is used to evaluate the trend<br>over 4 to 10 periods of measure, subject to data availability and comparability.
