
Search for Indicators
Suicide Prevention
Indicator Gauge Icon Legend
Legend Colors
Redis bad, Greenis good, Blueis not statistically different/neutral.
Compared to Distribution
 the value is in the best half of communities.
 the value is in the 2nd worst quarter of communities.
 the value is in the worst quarter of communities.
Compared to Target
 meets target;
  does not meet target.
Compared to a Single Value
 lower than the comparison value;
 higher than the comparison value;
 not statistically different from comparison value.
Trend

 non-significant change over time;

 significant change over time;
 no change over time.
Compared to Prior Value
 higher than the previous measurement period;
 lower than the previous measurement period;
 no statistically different change from previous measurement period.
Value
Compared to:
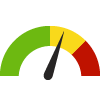
County: Calhoun Age-Adjusted Death Rate due to Suicide
County: Calhoun Age-Adjusted Death Rate due to Suicide
16.9
Deaths per 100,000 population
(2019-2023)
Compared to:


MI Counties
The distribution is based on data from 60 Michigan counties.
MI Value
(14.4)
The regional value is compared to the Michigan State value.
US Value
(13.5 in 2020)
The regional value is compared to the national value. The source for the national value is Centers for Disease Control and Prevention
Prior Value
(17.8)
Prior Value compares a measured value with the previously measured value. Confidence intervals were taken into account in determining the direction of the comparison.
Trend
This comparison measures the indicator’s values over multiple time periods.<br>The Mann-Kendall Test for Statistical Significance is used to evaluate the trend<br>over 4 to 10 periods of measure, subject to data availability and comparability.
HP 2030 Target
(12.8)
<div>MHMD-01: Reduce the suicide rate <strong>(LEADING HEALTH INDICATOR)</strong></div>
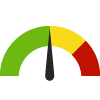
County: Calhoun Suicides
County: Calhoun Suicides
27
People
(2024)
Compared to:

Prior Value
(26)
Prior Value compares a measured value with the previously measured value. Confidence intervals were not taken into account in determining the direction of the comparison.
Trend
This comparison measures the indicator’s values over multiple time periods.<br>The Mann-Kendall Test for Statistical Significance is used to evaluate the trend<br>over 4 to 10 periods of measure, subject to data availability and comparability.
County: Calhoun High School Students who Felt Sad or Hopeless
County: Calhoun High School Students who Felt Sad or Hopeless
39.2%
Percent of Students
(2023-2024 School Year)
Compared to:
Prior Value
(44.8%)
Prior Value compares a measured value with the previously measured value. Confidence intervals were not taken into account in determining the direction of the comparison.
Trend
This comparison measures the indicator’s values over multiple time periods.<br>The Mann-Kendall Test for Statistical Significance is used to evaluate the trend<br>over 4 to 10 periods of measure, subject to data availability and comparability.
County: Calhoun High School Students who Made a Suicide Plan
County: Calhoun High School Students who Made a Suicide Plan
14.2%
Percent of Students
(2023-2024 School Year)
Compared to:
Prior Value
(16.6%)
Prior Value compares a measured value with the previously measured value. Confidence intervals were not taken into account in determining the direction of the comparison.
Trend
This comparison measures the indicator’s values over multiple time periods.<br>The Mann-Kendall Test for Statistical Significance is used to evaluate the trend<br>over 4 to 10 periods of measure, subject to data availability and comparability.
County: Calhoun High School Students who Seriously Considered Attempting Suicide
County: Calhoun High School Students who Seriously Considered Attempting Suicide
17.1%
Percent of Students
(2023-2024 School Year)
Compared to:
Prior Value
(20.6%)
Prior Value compares a measured value with the previously measured value. Confidence intervals were not taken into account in determining the direction of the comparison.
Trend
This comparison measures the indicator’s values over multiple time periods.<br>The Mann-Kendall Test for Statistical Significance is used to evaluate the trend<br>over 4 to 10 periods of measure, subject to data availability and comparability.
County: Calhoun High School Students who Attempted Suicide
County: Calhoun High School Students who Attempted Suicide
8.6%
Percent of Students
(2023-2024 School Year)
Compared to:
Prior Value
(10.9%)
Prior Value compares a measured value with the previously measured value. Confidence intervals were not taken into account in determining the direction of the comparison.
Trend
This comparison measures the indicator’s values over multiple time periods.<br>The Mann-Kendall Test for Statistical Significance is used to evaluate the trend<br>over 4 to 10 periods of measure, subject to data availability and comparability.
3.4%
Percent of Students
(2023-2024 School Year)
Compared to:
Prior Value
(3.0%)
Prior Value compares a measured value with the previously measured value. Confidence intervals were not taken into account in determining the direction of the comparison.
Trend
This comparison measures the indicator’s values over multiple time periods.<br>The Mann-Kendall Test for Statistical Significance is used to evaluate the trend<br>over 4 to 10 periods of measure, subject to data availability and comparability.
County: Calhoun Middle School Students who Felt Sad or Hopeless
County: Calhoun Middle School Students who Felt Sad or Hopeless
34.7%
Percent of Students
(2023-2024 School Year)
Compared to:

Prior Value
(37.8%)
Prior Value compares a measured value with the previously measured value. Confidence intervals were not taken into account in determining the direction of the comparison.
Trend
This comparison measures the indicator’s values over multiple time periods.<br>The Mann-Kendall Test for Statistical Significance is used to evaluate the trend<br>over 4 to 10 periods of measure, subject to data availability and comparability.
County: Calhoun Middle School Students who Made a Suicide Plan
County: Calhoun Middle School Students who Made a Suicide Plan
18.3%
Percent of Students
(2023-2024 School Year)
Compared to:
Prior Value
(20.0%)
Prior Value compares a measured value with the previously measured value. Confidence intervals were not taken into account in determining the direction of the comparison.
Trend
This comparison measures the indicator’s values over multiple time periods.<br>The Mann-Kendall Test for Statistical Significance is used to evaluate the trend<br>over 4 to 10 periods of measure, subject to data availability and comparability.
27.1%
Percent of Students
(2023-2024 School Year)
Compared to:
Prior Value
(27.6%)
Prior Value compares a measured value with the previously measured value. Confidence intervals were not taken into account in determining the direction of the comparison.
Trend
This comparison measures the indicator’s values over multiple time periods.<br>The Mann-Kendall Test for Statistical Significance is used to evaluate the trend<br>over 4 to 10 periods of measure, subject to data availability and comparability.
County: Calhoun Middle School Students who Attempted Suicide
County: Calhoun Middle School Students who Attempted Suicide
13.2%
Percent of Students
(2023-2024 School Year)
Compared to:
Prior Value
(17.0%)
Prior Value compares a measured value with the previously measured value. Confidence intervals were not taken into account in determining the direction of the comparison.
Trend
This comparison measures the indicator’s values over multiple time periods.<br>The Mann-Kendall Test for Statistical Significance is used to evaluate the trend<br>over 4 to 10 periods of measure, subject to data availability and comparability.
5.0%
Percent of Students
(2021-2022 School Year)
Compared to:
Prior Value
(5.5%)
Prior Value compares a measured value with the previously measured value. Confidence intervals were not taken into account in determining the direction of the comparison.
Trend
This comparison measures the indicator’s values over multiple time periods.<br>The Mann-Kendall Test for Statistical Significance is used to evaluate the trend<br>over 4 to 10 periods of measure, subject to data availability and comparability.
