
Search for Indicators
Substance Use in Youth
Indicator Gauge Icon Legend
Legend Colors
Red is bad, green is good, blue is not statistically different/neutral.
Compared to Distribution
 the value is in the best half of communities.
 the value is in the 2nd worst quarter of communities.
 the value is in the worst quarter of communities.
Compared to Target
 meets target;
  does not meet target.
Compared to a Single Value
 lower than the comparison value;
 higher than the comparison value;
 not statistically different from comparison value.
Trend

 non-significant change over time;
 significant change over time;
  no change over time.
Compared to Prior Value
 higher than the previous measurement period;
 lower than the previous measurement period;
 no statistically different change from previous measurement period.
Substance Use
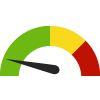
Teens who Binge Drink: 9th, 11th Graders County: Calhoun
Teens who Binge Drink: 9th, 11th Graders County: Calhoun
9.1%
(2022)
Compared to:
MI Value
(11.2% in 2020)
The regional value is compared to the 2019 Michigan state value for 9th - 12th graders.
Prior Value
(10.7%)
Prior Value compares a measured value with the previously measured value. Confidence intervals were not taken into account in determining the direction of the comparison.
Trend
This comparison measures the indicator’s values over multiple time periods.<br>The Mann-Kendall Test for Statistical Significance is used to evaluate the trend<br>over 4 to 10 periods of measure, subject to data availability and comparability.
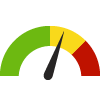
Teens who Used E-cigarettes: 9th, 11th Graders County: Calhoun
Teens who Used E-cigarettes: 9th, 11th Graders County: Calhoun
16.9%
(2022)
Compared to:
MI Value
(20.8% in 2020)
The regional value is compared to the 2019 Michigan state value for 9th - 12th graders.
Prior Value
(20.9%)
Prior Value compares a measured value with the previously measured value. Confidence intervals were not taken into account in determining the direction of the comparison.
Trend
This comparison measures the indicator’s values over multiple time periods.<br>The Mann-Kendall Test for Statistical Significance is used to evaluate the trend<br>over 4 to 10 periods of measure, subject to data availability and comparability.
Teens who Smoke: 9th, 11th Graders County: Calhoun
Teens who Smoke: 9th, 11th Graders County: Calhoun
1.3%
(2022)
Compared to:
MI Value
(4.5% in 2020)
The regional value is compared to the 2019 Michigan state value for 9th - 12th graders.
Prior Value
(1.8%)
Prior Value compares a measured value with the previously measured value. Confidence intervals were not taken into account in determining the direction of the comparison.
Trend
This comparison measures the indicator’s values over multiple time periods.<br>The Mann-Kendall Test for Statistical Significance is used to evaluate the trend<br>over 4 to 10 periods of measure, subject to data availability and comparability.
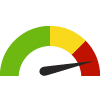
Teens who Use Marijuana: 9th, 11th Graders County: Calhoun
Teens who Use Marijuana: 9th, 11th Graders County: Calhoun
14.3%
(2022)
Compared to:
MI Value
(21.6% in 2020)
The regional value is compared to the 2019 Michigan state value for 9th - 12th graders.
Prior Value
(17.1%)
Prior Value compares a measured value with the previously measured value. Confidence intervals were not taken into account in determining the direction of the comparison.
Trend
This comparison measures the indicator’s values over multiple time periods.<br>The Mann-Kendall Test for Statistical Significance is used to evaluate the trend<br>over 4 to 10 periods of measure, subject to data availability and comparability.
High School Students who Reported Using Heroin County: Calhoun
High School Students who Reported Using Heroin County: Calhoun
0.0%
Percent of Students
(2021-2022 School Year)
Compared to:
Prior Value
(0.4%)
Prior Value compares a measured value with the previously measured value. Confidence intervals were not taken into account in determining the direction of the comparison.
Trend
This comparison measures the indicator’s values over multiple time periods.<br>The Mann-Kendall Test for Statistical Significance is used to evaluate the trend<br>over 4 to 10 periods of measure, subject to data availability and comparability.
Substance Use
Middle School Students who Took a Prescription Drug Not Prescribed to Them, Including Painkillers
Value
Compared to:
Middle School Students who Took a Prescription Drug Not Prescribed to Them, Including Painkillers County: Calhoun
Middle School Students who Took a Prescription Drug Not Prescribed to Them, Including Painkillers County: Calhoun
7.2%
Percent of Students
(2021-2022 School Year)
Compared to:


Prior Value
(4.0%)
Prior Value compares a measured value with the previously measured value. Confidence intervals were not taken into account in determining the direction of the comparison.
Trend
This comparison measures the indicator’s values over multiple time periods.<br>The Mann-Kendall Test for Statistical Significance is used to evaluate the trend<br>over 4 to 10 periods of measure, subject to data availability and comparability.
Substance Use
Middle School Students who Took Painkillers without a Doctor's Prescription
Value
Compared to:
Middle School Students who Took Painkillers without a Doctor's Prescription County: Calhoun
Middle School Students who Took Painkillers without a Doctor's Prescription County: Calhoun
5.3%
Percent of Students
(2021-2022 School Year)
Compared to:
Prior Value
(2.7%)
Prior Value compares a measured value with the previously measured value. Confidence intervals were not taken into account in determining the direction of the comparison.
Trend
This comparison measures the indicator’s values over multiple time periods.<br>The Mann-Kendall Test for Statistical Significance is used to evaluate the trend<br>over 4 to 10 periods of measure, subject to data availability and comparability.
Substance Use
Middle School Students who Took a Prescription Drug Such as Ritalin, Adderall or Xanax without a Doctor's Prescription
Value
Compared to:
Middle School Students who Took a Prescription Drug Such as Ritalin, Adderall or Xanax without a Doctor's Prescription County: Calhoun
Middle School Students who Took a Prescription Drug Such as Ritalin, Adderall or Xanax without a Doctor's Prescription County: Calhoun
4.1%
Percent of Students
(2021-2022 School Year)
Compared to:

Prior Value
(2.2%)
Prior Value compares a measured value with the previously measured value. Confidence intervals were not taken into account in determining the direction of the comparison.
Trend
This comparison measures the indicator’s values over multiple time periods.<br>The Mann-Kendall Test for Statistical Significance is used to evaluate the trend<br>over 4 to 10 periods of measure, subject to data availability and comparability.
Substance Use
High School Students who Took a Prescription Drug Not Prescribed to Them, Including Painkillers
Value
Compared to:
High School Students who Took a Prescription Drug Not Prescribed to Them, Including Painkillers County: Calhoun
High School Students who Took a Prescription Drug Not Prescribed to Them, Including Painkillers County: Calhoun
4.5%
Percent of Students
(2021-2022 School Year)
Compared to:
Prior Value
(6.5%)
Prior Value compares a measured value with the previously measured value. Confidence intervals were not taken into account in determining the direction of the comparison.
Trend
This comparison measures the indicator’s values over multiple time periods.<br>The Mann-Kendall Test for Statistical Significance is used to evaluate the trend<br>over 4 to 10 periods of measure, subject to data availability and comparability.
Substance Use
High School Students who Took Painkillers without a Doctor's Prescription
Value
Compared to:
High School Students who Took Painkillers without a Doctor's Prescription County: Calhoun
High School Students who Took Painkillers without a Doctor's Prescription County: Calhoun
3.1%
Percent of Students
(2021-2022 School Year)
Compared to:
Prior Value
(5.6%)
Prior Value compares a measured value with the previously measured value. Confidence intervals were not taken into account in determining the direction of the comparison.
Trend
This comparison measures the indicator’s values over multiple time periods.<br>The Mann-Kendall Test for Statistical Significance is used to evaluate the trend<br>over 4 to 10 periods of measure, subject to data availability and comparability.
Substance Use
High School Students who Took a Prescription Drug without a Doctor's Prescription
Value
Compared to:
High School Students who Took a Prescription Drug without a Doctor's Prescription County: Calhoun
High School Students who Took a Prescription Drug without a Doctor's Prescription County: Calhoun
2.4%
Percent of Students
(2021-2022 School Year)
Compared to:
Prior Value
(3.2%)
Prior Value compares a measured value with the previously measured value. Confidence intervals were not taken into account in determining the direction of the comparison.
Trend
This comparison measures the indicator’s values over multiple time periods.<br>The Mann-Kendall Test for Statistical Significance is used to evaluate the trend<br>over 4 to 10 periods of measure, subject to data availability and comparability.
Attitudes towards Substances
Attitudes towards Substances
Middle School Students who Reported Their Friends Felt Using Prescription Drugs Not Prescribed to Them As Wrong or Very Wrong
Value
Compared to:
Middle School Students who Reported Their Friends Felt Using Prescription Drugs Not Prescribed to Them As Wrong or Very Wrong County: Calhoun
Middle School Students who Reported Their Friends Felt Using Prescription Drugs Not Prescribed to Them As Wrong or Very Wrong County: Calhoun
89.7%
Percent of Students
(2021-2022 School Year)
Compared to:


Prior Value
(91.2%)
Prior Value compares a measured value with the previously measured value. Confidence intervals were not taken into account in determining the direction of the comparison.
Trend
This comparison measures the indicator’s values over multiple time periods.<br>The Mann-Kendall Test for Statistical Significance is used to evaluate the trend<br>over 4 to 10 periods of measure, subject to data availability and comparability.
Attitudes towards Substances
Middle School Students who Reported Their Parents Felt Using Prescription Drugs Not Prescribed to Them As Wrong or Very Wrong
Value
Compared to:
Middle School Students who Reported Their Parents Felt Using Prescription Drugs Not Prescribed to Them As Wrong or Very Wrong County: Calhoun
Middle School Students who Reported Their Parents Felt Using Prescription Drugs Not Prescribed to Them As Wrong or Very Wrong County: Calhoun
96.4%
Percent of Students
(2021-2022 School Year)
Compared to:

Prior Value
(96.8%)
Prior Value compares a measured value with the previously measured value. Confidence intervals were not taken into account in determining the direction of the comparison.
Trend
This comparison measures the indicator’s values over multiple time periods.<br>The Mann-Kendall Test for Statistical Significance is used to evaluate the trend<br>over 4 to 10 periods of measure, subject to data availability and comparability.
Attitudes towards Substances
Middle School Students who Reported Using Prescription Drugs Not Prescribed to Them Has Moderate or Great Risk
Value
Compared to:
Middle School Students who Reported Using Prescription Drugs Not Prescribed to Them Has Moderate or Great Risk County: Calhoun
Middle School Students who Reported Using Prescription Drugs Not Prescribed to Them Has Moderate or Great Risk County: Calhoun
61.2%
Percent of Students
(2021-2022 School Year)
Compared to:
Prior Value
(69.7%)
Prior Value compares a measured value with the previously measured value. Confidence intervals were not taken into account in determining the direction of the comparison.
Trend
This comparison measures the indicator’s values over multiple time periods.<br>The Mann-Kendall Test for Statistical Significance is used to evaluate the trend<br>over 4 to 10 periods of measure, subject to data availability and comparability.
Attitudes towards Substances
High School Students who Reported Their Friends Felt Using Prescription Drugs Not Prescribed to Them As Wrong or Very Wrong
Value
Compared to:
High School Students who Reported Their Friends Felt Using Prescription Drugs Not Prescribed to Them As Wrong or Very Wrong County: Calhoun
High School Students who Reported Their Friends Felt Using Prescription Drugs Not Prescribed to Them As Wrong or Very Wrong County: Calhoun
87.0%
Percent of Students
(2021-2022 School Year)
Compared to:
Prior Value
(87.0%)
Prior Value compares a measured value with the previously measured value. Confidence intervals were not taken into account in determining the direction of the comparison.
Trend
This comparison measures the indicator’s values over multiple time periods.<br>The Mann-Kendall Test for Statistical Significance is used to evaluate the trend<br>over 4 to 10 periods of measure, subject to data availability and comparability.
Attitudes towards Substances
High School Students who Reported Their Parents Felt Using Prescription Drugs Not Prescribed to Them As Wrong or Very Wrong
Value
Compared to:
High School Students who Reported Their Parents Felt Using Prescription Drugs Not Prescribed to Them As Wrong or Very Wrong County: Calhoun
High School Students who Reported Their Parents Felt Using Prescription Drugs Not Prescribed to Them As Wrong or Very Wrong County: Calhoun
96.5%
Percent of Students
(2021-2022 School Year)
Compared to:
Prior Value
(96.0%)
Prior Value compares a measured value with the previously measured value. Confidence intervals were not taken into account in determining the direction of the comparison.
Trend
This comparison measures the indicator’s values over multiple time periods.<br>The Mann-Kendall Test for Statistical Significance is used to evaluate the trend<br>over 4 to 10 periods of measure, subject to data availability and comparability.
Attitudes towards Substances
High School Students who Reported Using Prescription Drugs Not Prescribed to Them Has Moderate or Great Risk
Value
Compared to:
High School Students who Reported Using Prescription Drugs Not Prescribed to Them Has Moderate or Great Risk County: Calhoun
High School Students who Reported Using Prescription Drugs Not Prescribed to Them Has Moderate or Great Risk County: Calhoun
72.2%
Percent of Students
(2021-2022 School Year)
Compared to:
Prior Value
(74.5%)
Prior Value compares a measured value with the previously measured value. Confidence intervals were not taken into account in determining the direction of the comparison.
Trend
This comparison measures the indicator’s values over multiple time periods.<br>The Mann-Kendall Test for Statistical Significance is used to evaluate the trend<br>over 4 to 10 periods of measure, subject to data availability and comparability.
